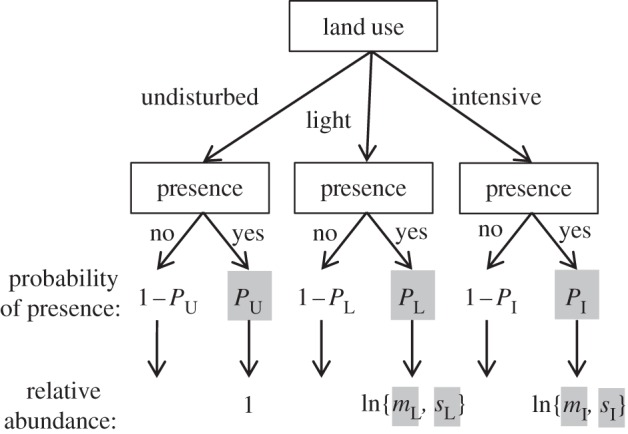
Figure 2.

Model structure relating the presence or the absence, and given presence local abundance, of a species in three classes of land-use intensity (undisturbed, light use and intensive use). In each class, the species was defined as being present with probability PU, PL and PI. Abundances were normalized to 1 in the undisturbed land-use class. Observed abundances in the light and intensive land-use intensity classes were assumed to follow a lognormal distribution (denoted ln{}) with mean (mL and mI) and s.d. (sL and sI). Thus, the basic model estimated seven parameters, highlighted in grey.
