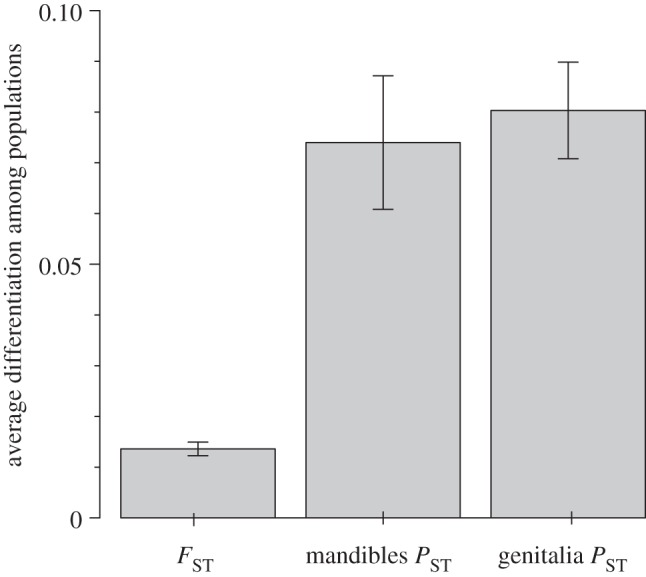
Figure 3.

Comparison of average phenotypic and genetic divergence across populations. The average PST-value across populations for both the mandibles and genitalia is significantly greater than the average FST-value across populations. See the electronic supplementary material, table S1 for details about individual population comparisons, and figure S1 which demonstrates that this conclusion is robust to a broad range of heredity scalars (i.e. from 0.1 to 0.9) used to calculate PST.
