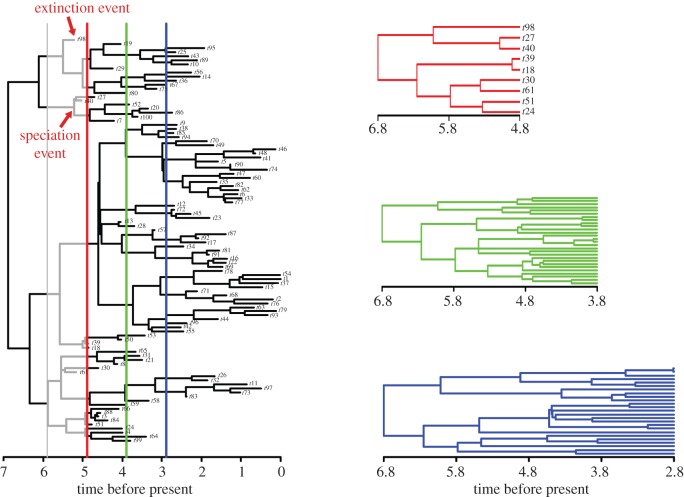
Figure 1.
Schematic of the methods applied here to compute phenotypical evolutionary and net diversification rates over consecutive time bins. The full tree to the left is terminated at each bin's upper boundary (the colour lines running across the tree), to produce time bin phylogenies (to the right). For each time bin, the difference between the total number of speciation minus the total number of extinction events is divided for the time bin evolutionary time (grey branches in the tree on the left) to get the diversification rate for that bin. Time bin phylogenies (on the right) are then used to compute the time bin phenotypic evolutionary rate.

