Figure 2.

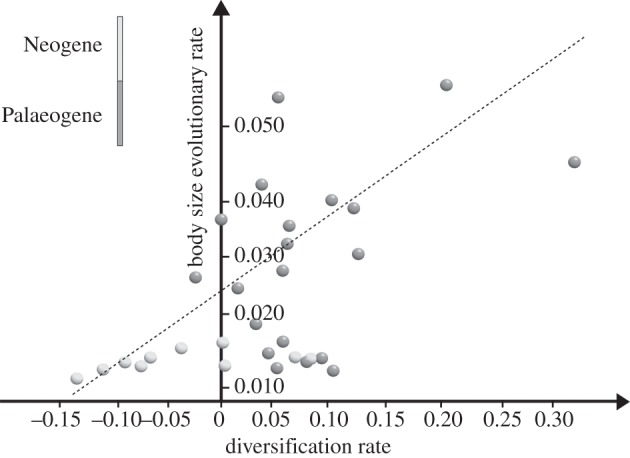
The relationship between rates of taxonomic (x-axis) and body size (y-axis) diversification rates. Dark grey circles represent Palaeogene time bins. Light grey circles represent Neogene time bins.

The relationship between rates of taxonomic (x-axis) and body size (y-axis) diversification rates. Dark grey circles represent Palaeogene time bins. Light grey circles represent Neogene time bins.