
Figure 4.
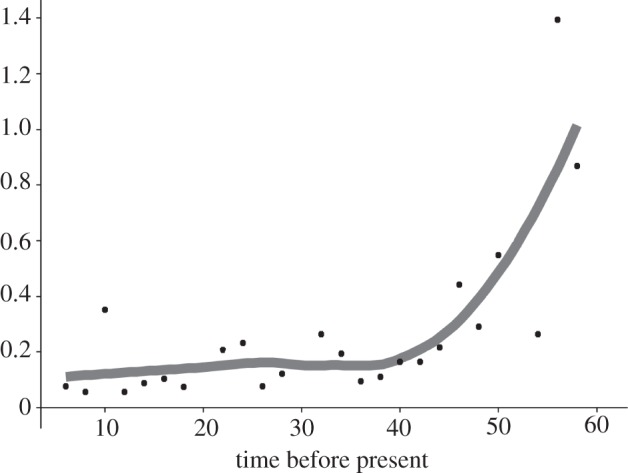
The phenotypic evolutionary rate through time. The points represent the average rate per bin computed over 100 randomly resolved trees. The grey line represents the smoothed mean of the rate.
Official websites use .gov
A
.gov website belongs to an official
government organization in the United States.
Secure .gov websites use HTTPS
A lock (
) or https:// means you've safely
connected to the .gov website. Share sensitive
information only on official, secure websites.
The phenotypic evolutionary rate through time. The points represent the average rate per bin computed over 100 randomly resolved trees. The grey line represents the smoothed mean of the rate.