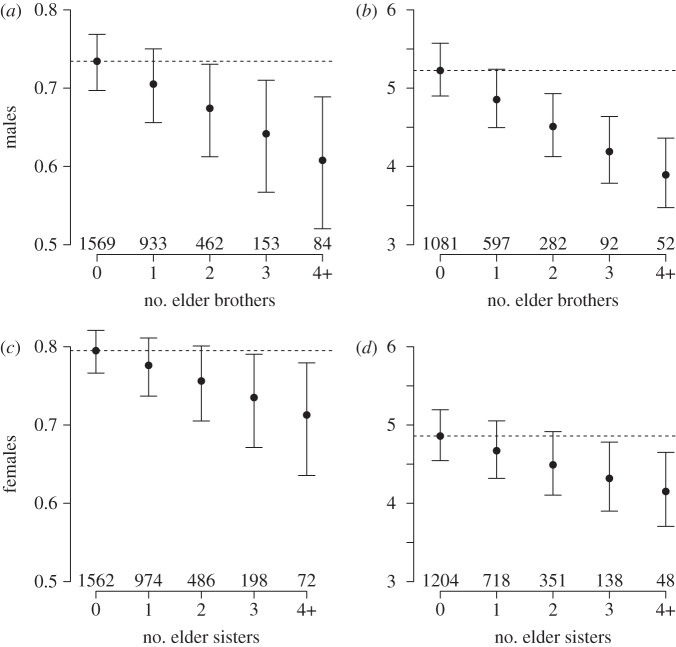
Figure 2.
Reproductive success of individuals surviving to adulthood: (a) Males' probability of reproducing ( p < 0.001) and, for those who reproduced, (b) offspring count (
 p < 0.001), according to their number of elder brothers. (c) Females’ probability of reproducing (
 p = 0.02) and, for those who reproduced, (d) offspring count (
 p < 0.001), according to their number of elder sisters. Figures show predicted values of the model and error bars represent standard errors of the means. The horizontal dashed line represents the predicted value in the case when the individual had no elder brothers or no elder sisters. Numbers below bars represent the sample size.

