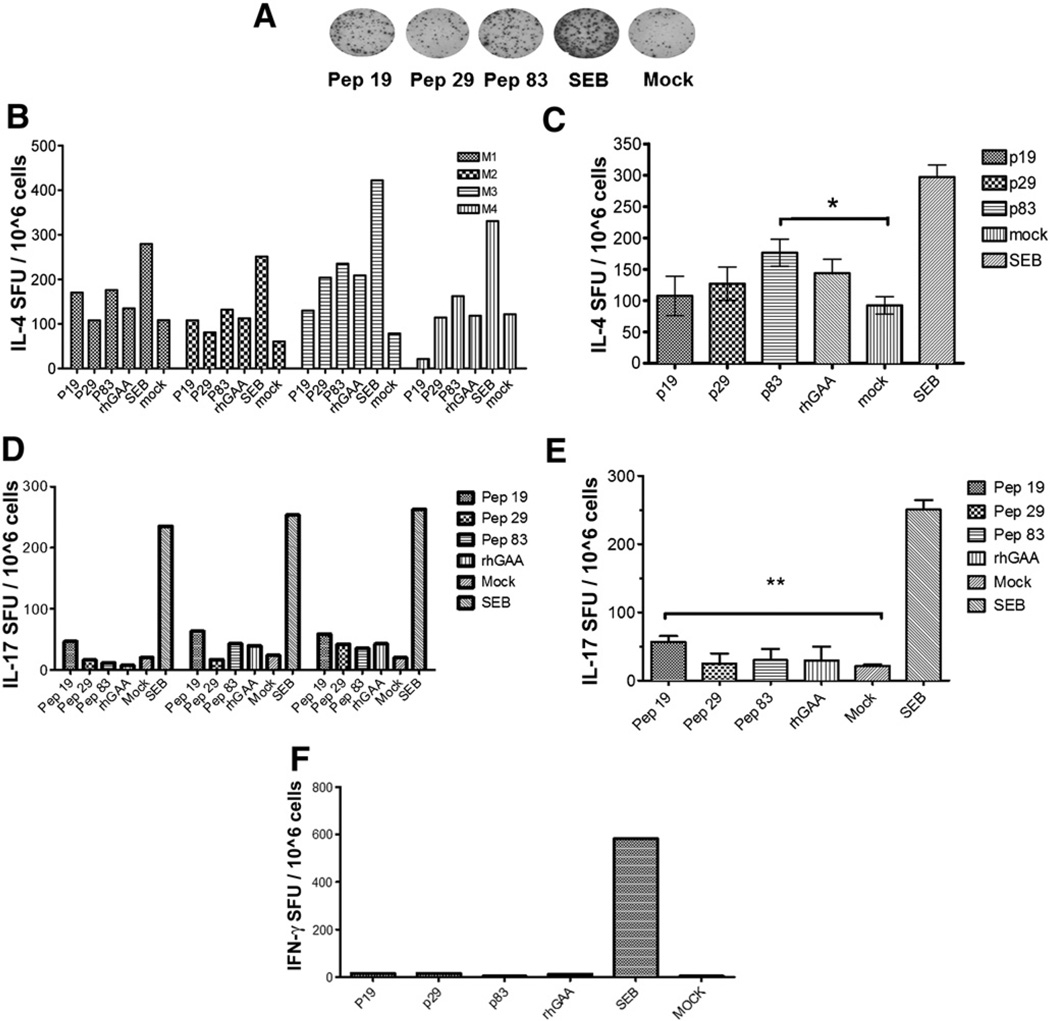
Fig. 6.
Cytokine responses to the immunodominant epitopes upon ERT in Pompe mice. GAA−/− 129SVE mice received 3 weekly intravenous doses of rhGAA (20 mg/kg) followed by splenocyte assays. A. Representative examples of well images IL-4 ELISpot assay after stimulation with peptide 19, 29, or 83, or GAA protein, or SEB, or mock controls. B. Average frequencies of IL-4 spot forming units for 4 mice assayed individually (duplicate stimulations). C. Average values (± SD) for the group of 4 animals. Peptide 83 showed statistically significant responses compared to mock stimulation. D. Average frequencies of IL-17 spot forming units for 3 mice assayed individually (duplicate stimulations). E. Average values (± SD) for the group of 3 animals. Peptide 19 showed statistically significant responses compared to mock stimulation. F. Average values (± SD) for 4 animals assayed by IFN-γ ELISpot.

