
Fig. 2.
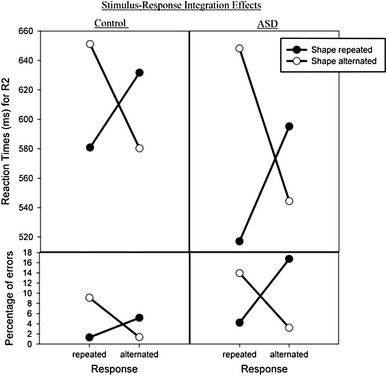
Mean reaction times and error percentages (on R2) for repetition versus alternation of the shape as a function of response repetition versus alternation and the group
Official websites use .gov
A
.gov website belongs to an official
government organization in the United States.
Secure .gov websites use HTTPS
A lock (
) or https:// means you've safely
connected to the .gov website. Share sensitive
information only on official, secure websites.
Mean reaction times and error percentages (on R2) for repetition versus alternation of the shape as a function of response repetition versus alternation and the group