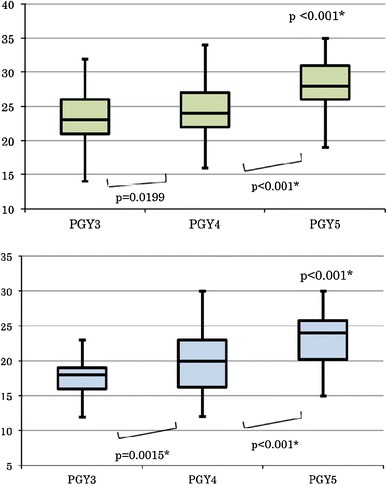
Fig. 4.

Correlation between the postgraduate year and the score. The scores were compared among the second terms of postgraduate years 3, 4, and 5. Above as a surgeon. Below as a first assistant. The differences in the scores of these three groups were significant (Kruskal–Wallis test, <0.001 and <0.001, respectively)
