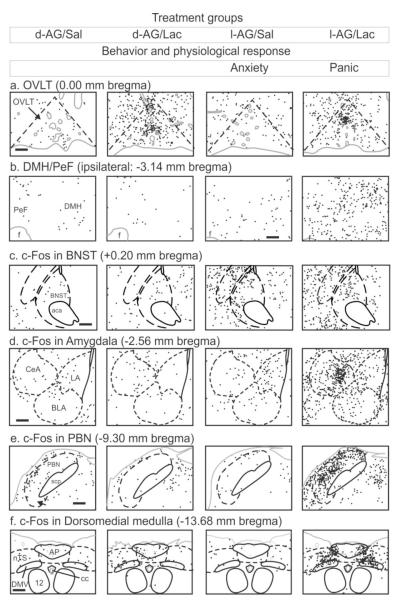
Figure 3.
Drawings illustrating cellular responses [i.e. numbers of c-Fos-immunoreactive (ir) cells with each black dot = 1 c-Fos-ir cell] from each of four treatment groups from figure 2 [columns respectively represent d-allylglycine (d-AG) inactive isomer into DMH/PeF+ i.v. isotonic saline infusion (Sal), d-AG+i.v. sodium lactate infusion (Lac), GABA synthesis inhibitor l-allyglycine (l-AG) into DMH/PeF+Lac, and l-AG+Lac] in key subregions involved in: a) sensing plasma perameters such as sodium lactate (i.e., organum vasculosum lamina terminalis, OVLT); b) panic generating site (i.e., DMH/PeF); c) unconditioned anxiety (i.e., bed nucleus of the stria terminalis, BNST); d) conditioned fear and sympathoexcitation (i.e., central, CeA; basolateral, BLA; and lateral, LA; amygdala); e) respiratory regulation (i.e., parabrachial nucleus, PBN); f) baroreceptor desensitization (i.e., nucleus of the solitary tract, nTS; dorsal motor nucleus of the vagus, DMV). Gray solid lines indicate the outline of the brain section and blood vessels. Black solid lines indicate white matter tracts or cranial nerves. Black dashed lines indicate the brain nuclei. A standard rat stereotaxic atlas of the brain was used to determine, bregma, and delineated areas [210]Columns 3-4 has increased anxiety, and column 4 also had cardiorespiratory responses (see Figure 2 for details). Figure 3a-f adapted by permission from [68]. See also [68] article for additional information.

