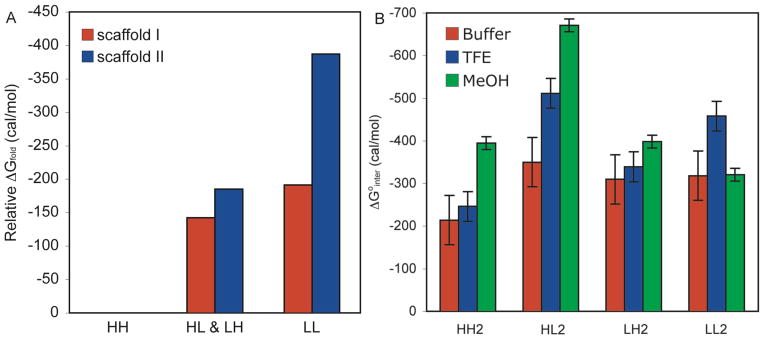
Figure 4.

(A) Comparison of Scaffold I and Scaffold II Stabilities. The stabilities relative to HH are shown. The average stability for the peptides substituted with both Hfl and Leu is shown. For both scaffolds, peptides substituted with Hfl at both X1 and X2 were the least stable. (B) ΔG°interact for Scaffold II Peptides. Red, 15 μM peptide, 10 mM phosphate buffer, pH 7.0, 25 °C. Blue, 15 μM peptide, 40% 10 mM phosphate buffer, pH 7.0, 60% TFE, 25 °C. Green, 15 μM peptide, 10% 10 mM phosphate buffer, pH 7.0, 90% MeOH, 25 °C. Error bars are the 95% confidence intervals from five independent measurements as determined using a multiple comparison test. Interaction energies were calculated using Equation 8.
