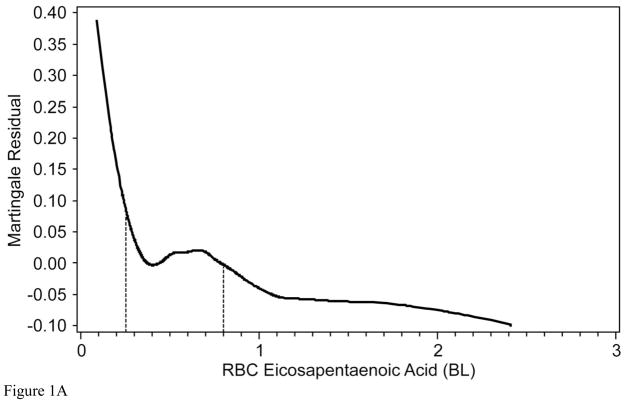
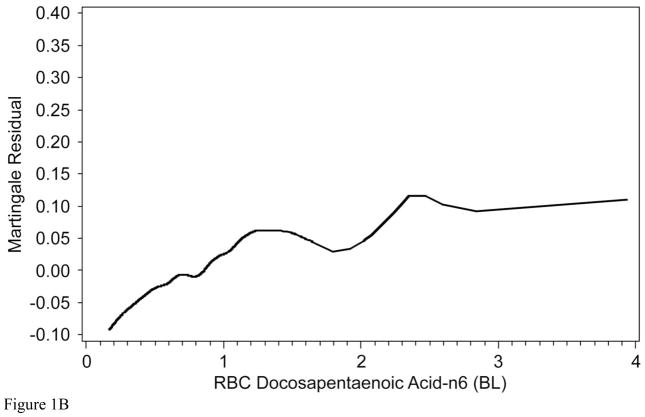
Figure 1.
The Martingale residual plots show the difference between the observed and predicted (by GRACE score) 2-year mortality as a function of two RBC fatty levels: A) eicosapentaenoic acid (EPA) and B) n-6 docosapentaenoic acid (both expressed as a % of total RBC fatty acids). Values above 0 represent more deaths than predicted, and those below, fewer deaths than predicted. The relationship between EPA and risk was non-linear, therefore cut points (vertical lines) were selected to estimate high (<0.25%), intermediate (0.25% and 0.8%) and low risk categories (>0.8%). Therefore, EPA was modeled as a categorical variable. Relationships with DPA were relatively linear, therefore this fatty acid was modeled as a continuous variable.


