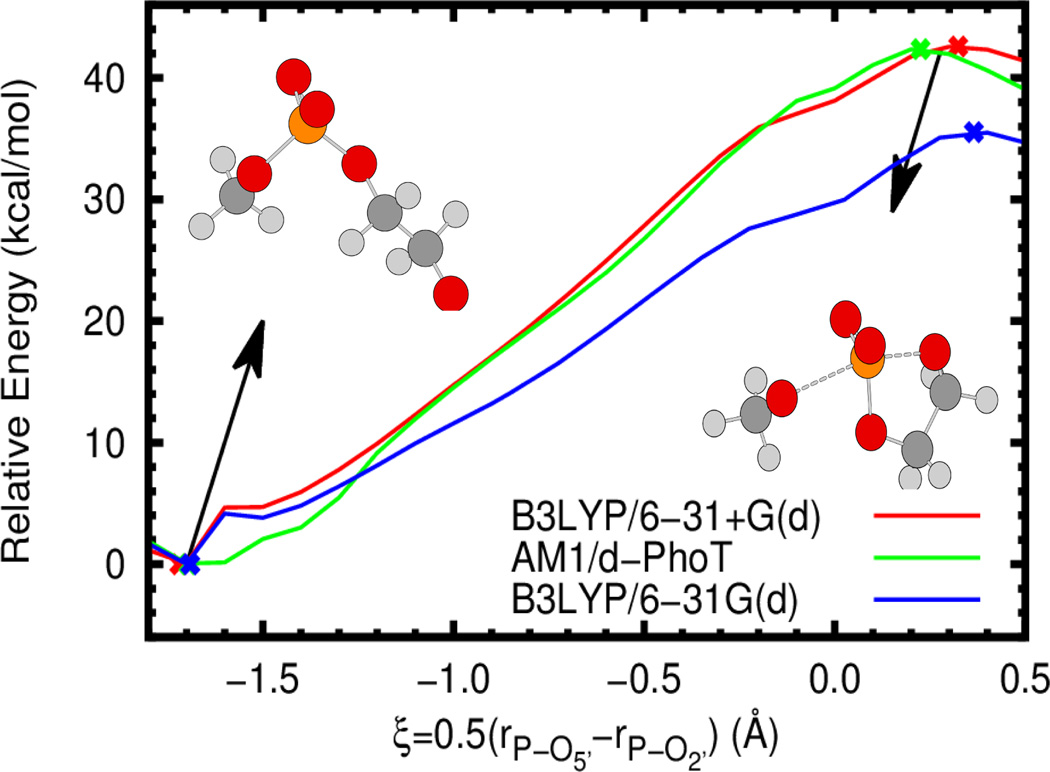
Figure 2.
Gas phase potential energy profiles for the 2’-O-transesterification of 2-hydroxy ethyl methyl phosphate (see inset) at the B3LYP/6-31+G(d) (red), B3LYP/6-31G(d) (blue), and AM1/d-PhoT (green) levels (as implemented in Gaussian 0986 and AMBER12/AmberTools1229,37,87 respectively). The approximate reaction coordinate paths are obtained via constrained optimization at different coordinate values (using the DL-FIND library88). Crosses denote the location of optimized minima and transition states. All energies are relative to the optimized minimum at the relevant level of theory.

