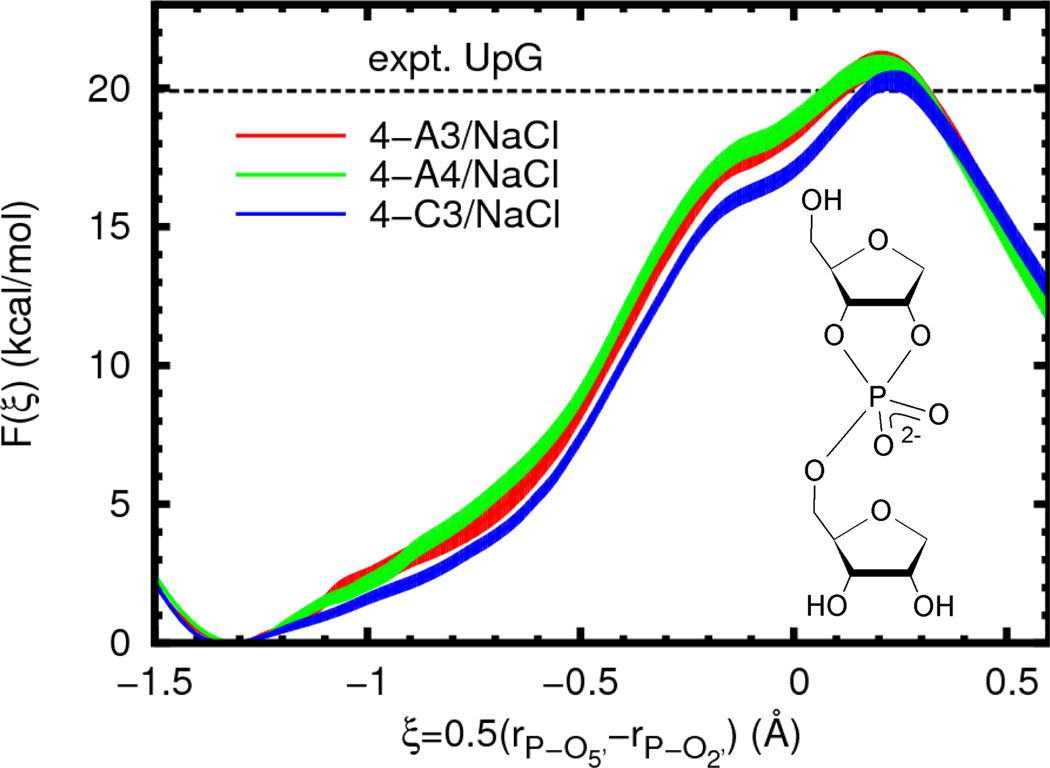
Figure 4.
Free energy profiles for reaction model 4 (inset) with different force field models in the presence of sodium chloride. The experimental value is given for a UpG dinucleotide (Ref. 25, 310 K and ionic strength of 1 M in NaOH/NaCl, dashed line). In order to aid visual comparison of barrier heights, the plots are shifted such that F(ξR) = 0.0. Filled curves represent estimated 95% confidence intervals relative to the appropriate reactant state.

