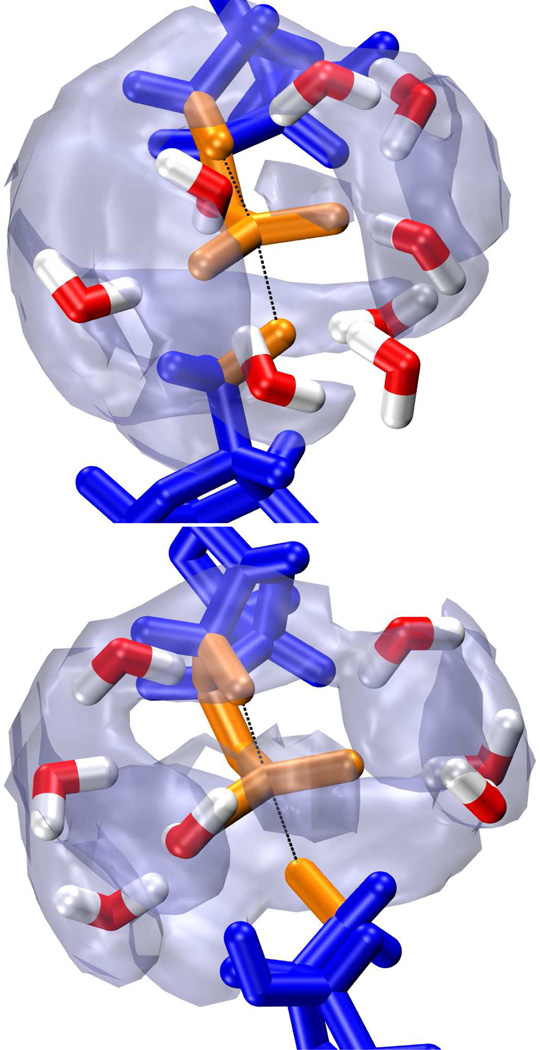
Figure 6.
Snapshots from umbrella sampling simulations near the transition state of model 4-A3 (top) and 4-A4 (bottom). Both transition state structures consist of a pentacoordinated phosphorane (orange) with advanced bond formation between the phosphorous and 2’ oxygen (upper black line) and bond cleavage between the phosphorous and 5’ oxygen (lower black line). This is indicative of a “late” transition state. Density maps of the water oxygens [transparent gray, isosurfaces correspond to 4πρbulkg(rmax)] indicate three distinct areas of low solvation around the phosphorane.

