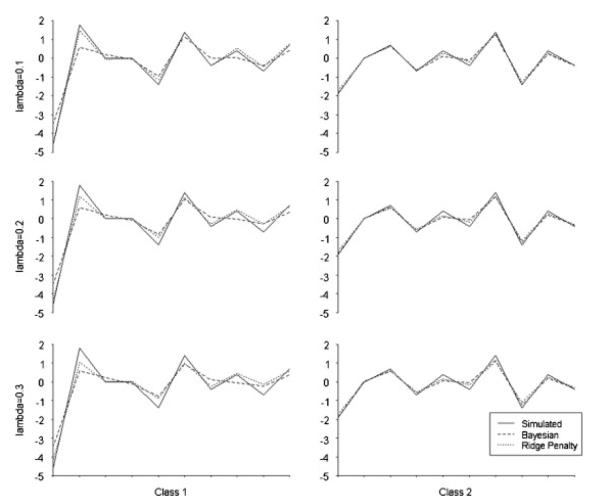
Figure 2.
Comparison of estimates from Bayesian and penalization simulations. Estimates are analogous to the scenario in Table II, with ρ=0.9, and all non-intercept coefficients penalized, but with N=500. The optimal λ value was 0.2. Each graph plots (Y-axis) for the intercept and nine covariates by class and λ value.

