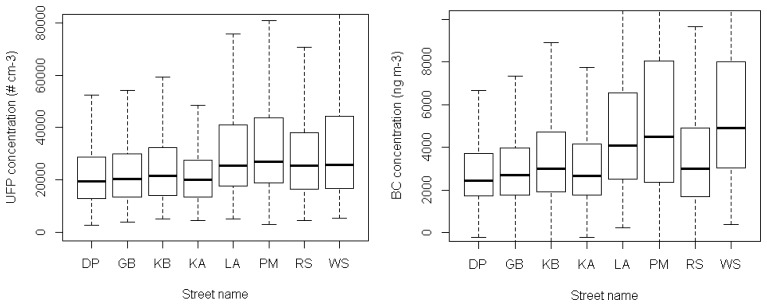
Figure 9.
Boxplot of the UFP and BC concentrations for the streets of the monitoring route (merged data from the entire monitoring campaign). DP = Dageraadplaats; GB = Grotebeerstraat; KB = Kleinebeerstraat; KA = Korte Altaarstraat; LA = Lange Altaarstraat; PM = Plantin & Moretuslei; RS = Raafstraat; WS = Wolfstraat.


