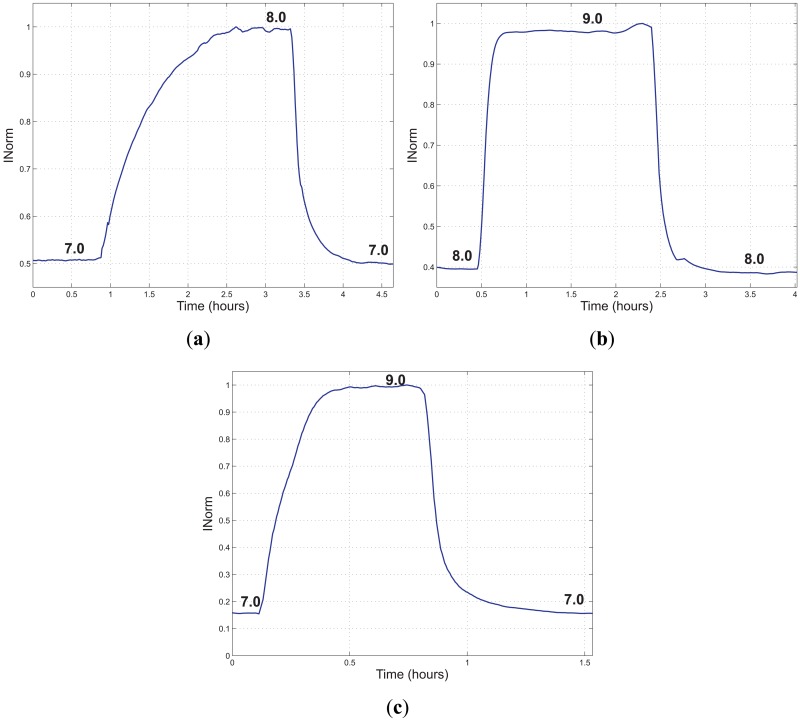
Figure 13.
INorm versus time acquired during the three tests performed to evaluate the response time of the sensor and its dependency on the pH value. (a) Sensor response to a change in pH from 7 to 8 and back; (b) sensor response to a change in pH from 8 to 9 and back; (c) sensor response to a change in pH from 7 to 9 and back.

