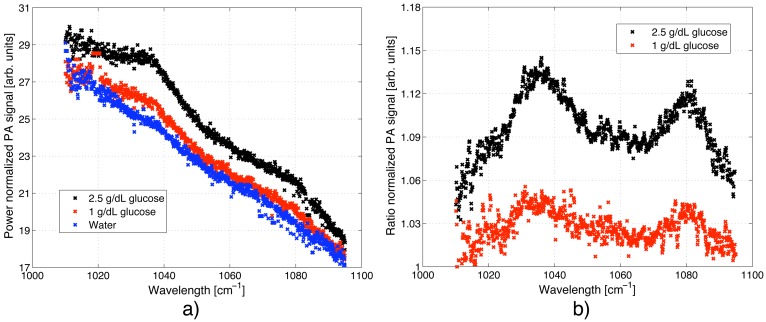
Figure 6.
PA spectrum of an aqueous solution with 0, 1.0 and 2.5 g/dL glucose. The QCL was tuned via the external grating and modulation with a frequency of 117 Hz. (a) The PA signal was normalized with the output power of the QCL. The wavelength dependent transmission of the fiber was not taken into account, which results in a reduced PA signal for larger wavenumbers; (b) Taking the ratio between the glucose and water spectrum reveals the two glucose absorption peaks at 1,034 and 1,080 cm−1.

