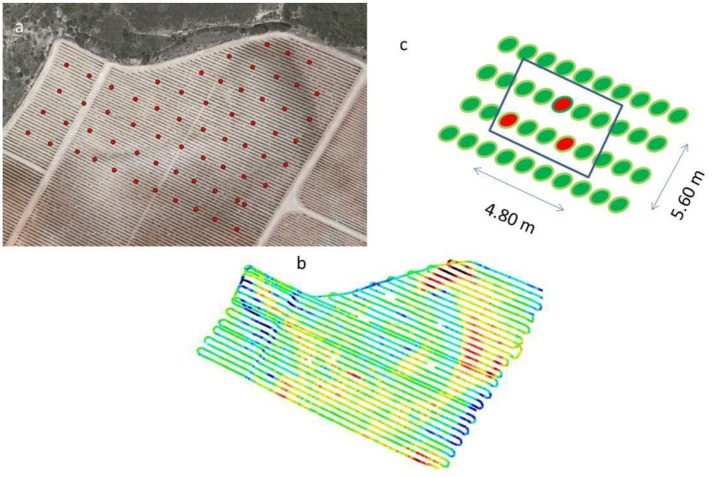
Figure 2.
Field measurement locations (a) aerial photograph of the field with the position of plant measurement sites (red dots: center of each plant measurement block). (b) electrical resistivity transects with average ER values for layer 1 (0–50 cm depth). (c) scheme of a typical plant block with the three vines (in red) used for measurements.

