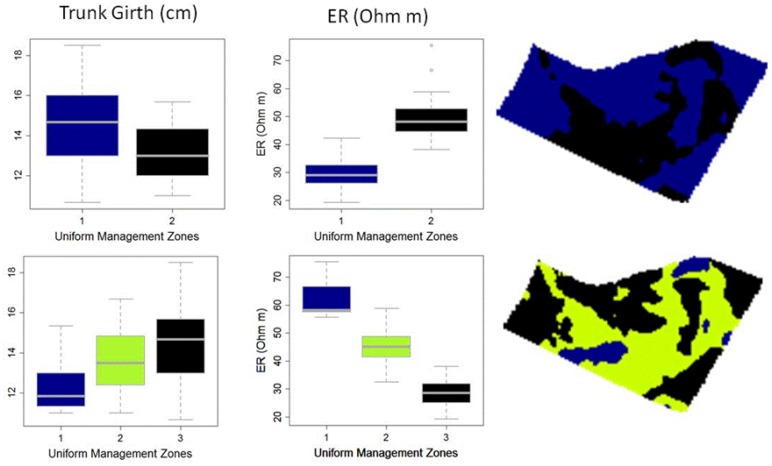
Figure 8.
Boxplots of trunk girth and ER with increasing number of clusters (left) and uniform management zones maps derived by the clustering analysis (right). Top: management zone 1: blue; management zone 2: black. Bottom: management zone 1: blue; management zone 2: green; management zone 3: blue.

