
Figure 1.
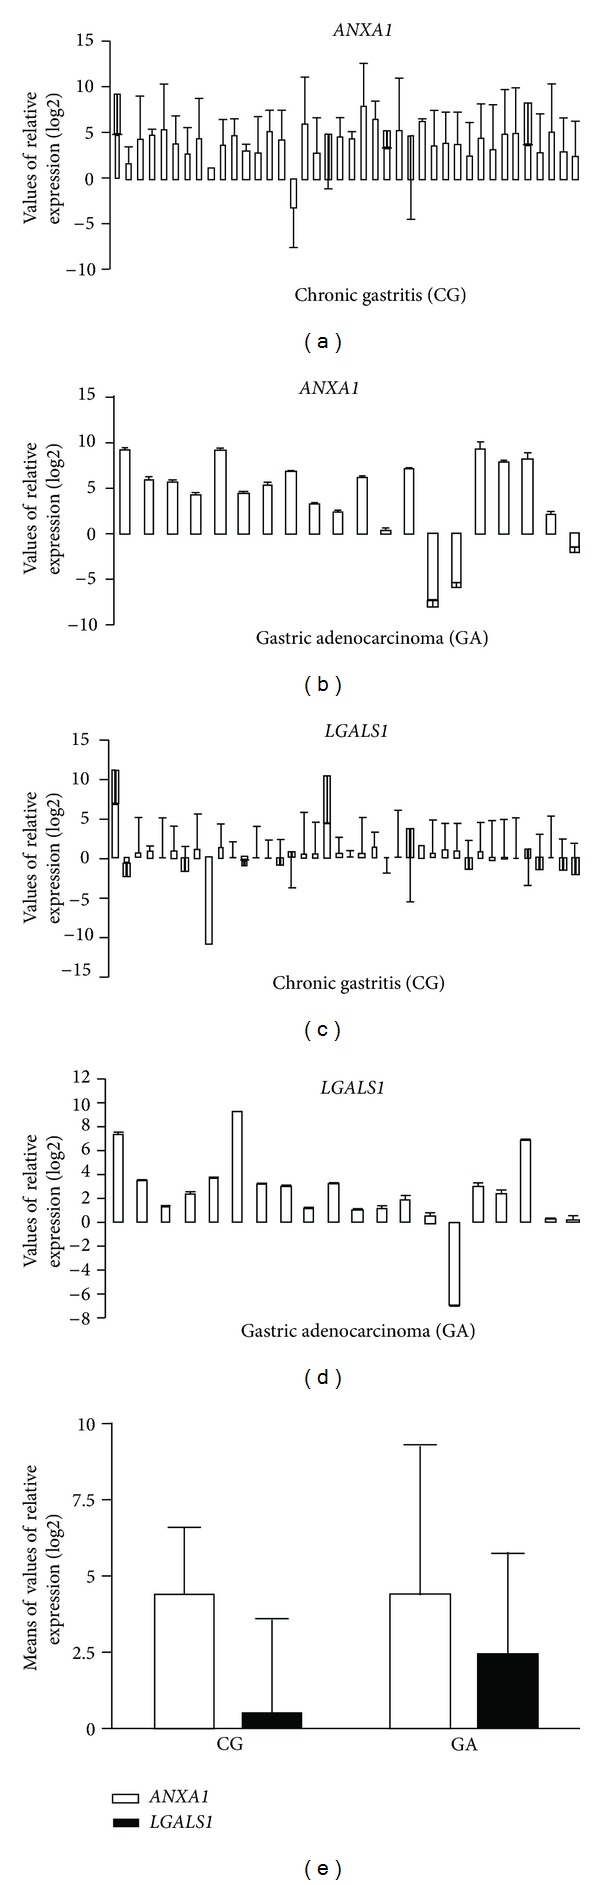
Values of relative gene expression (log2) of ANXA1 (a, b) and LGALS1 (c, d) and means of values of relative gene expression (e) in the chronic gastritis (CG) and gastric adenocarcinoma (GA) groups.
Official websites use .gov
A
.gov website belongs to an official
government organization in the United States.
Secure .gov websites use HTTPS
A lock (
) or https:// means you've safely
connected to the .gov website. Share sensitive
information only on official, secure websites.
Values of relative gene expression (log2) of ANXA1 (a, b) and LGALS1 (c, d) and means of values of relative gene expression (e) in the chronic gastritis (CG) and gastric adenocarcinoma (GA) groups.