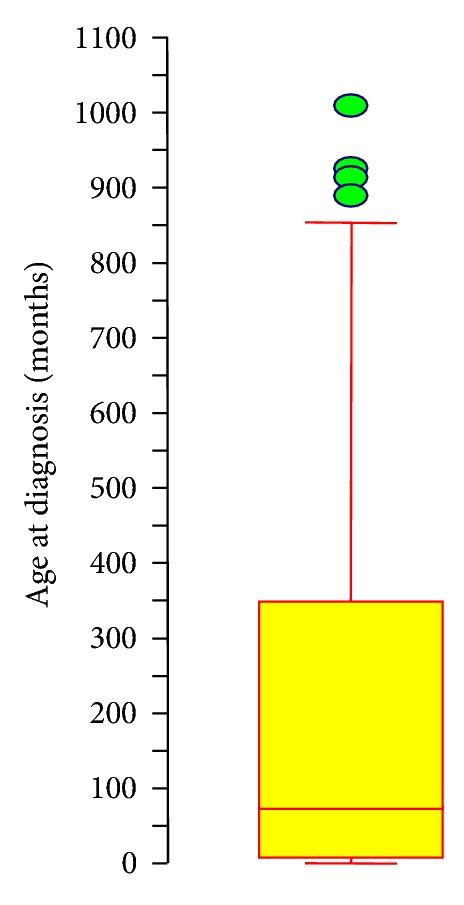
Figure 1.

Age Boxplot. Boxplot showing median age (solid line within box) with borders of box representing 25th and 75th percentiles with 95% confidence intervals. Circles indicate individual outliers, the oldest of which is 1008 months at diagnosis.
