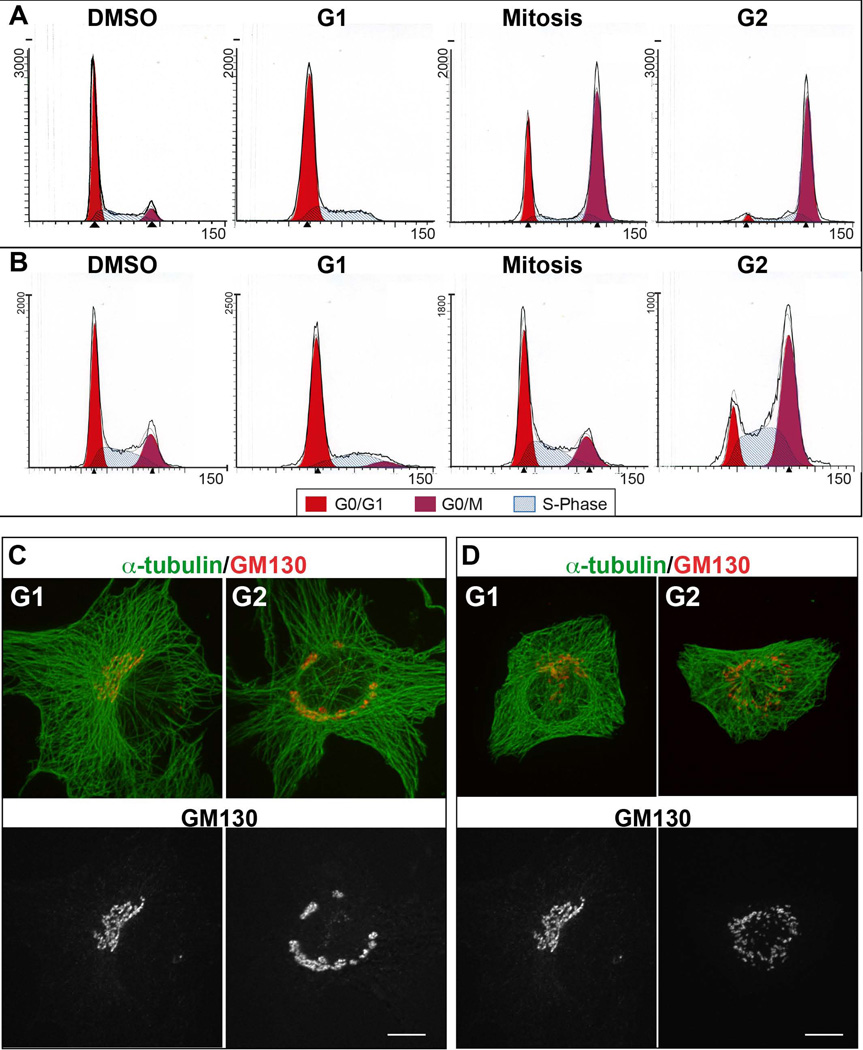
Figure 1. Golgi and MT Organization in G1 versus G2 Synchronized Cells.
(A, B) Propidium Iodide fluorescence profiles of RPE (A) and LLC-PK1 (B) cells in DMSO treated, G1, G2 or mitotic arrest. The cells synchronized as noted were analyzed by flow cytometry according to their DNA content. (C, D) Representative images of RPE (C) or LLC-PK1 (D) cells in G1 and G2 immunostained for α-tubulin (Upper panel, green) and GM130 (upper panel, red; lower panel, grayscale). Maximal projection of confocal z stacks is shown. Gamma adjustment was used to highlight low-light details. Scale bar, 10 µm.

