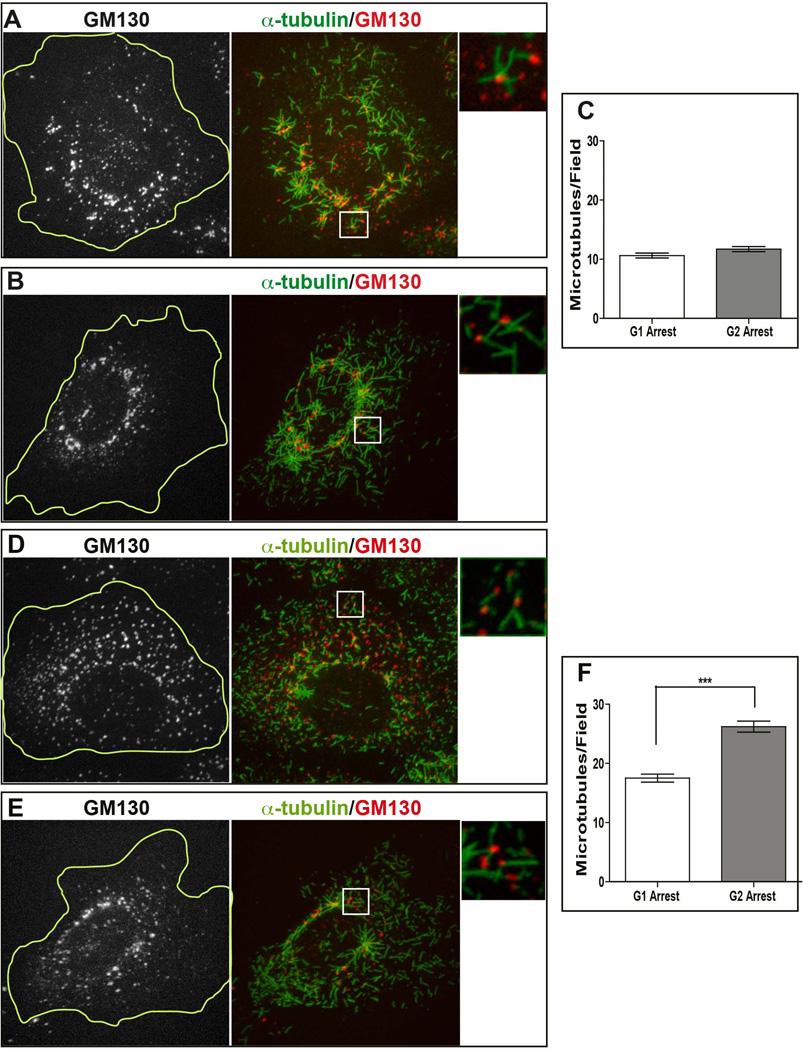
Figure 2. MT nucleation at the Golgi during G1 and G2.
(A,B,D,E) Representative immunofluorescence images of RPE (A, B) and LLC-PK1 (D, E) cells synchronized in G1 (A, D) or G2 (B, E) after nocodazole washout. After 45-second period of MT re-growth, cells were fixed and stained for α-tubulin (central and right panels, green) and GM130 (left panel, grayscale; central and right panels, red). Cell border is outlined at the greyscale images (yellow line). Maximal projection of confocal z stacks is shown. Right panel represents enlarged insets (boxed in the central panel). Gamma adjustment was used to highlight low-light details. Scale bar, 10 µm. (C, F) Quantification of MT number per field in G1 (n=57) and G2 (n=58) in synchronized RPE (C) and LLC-PK1 (F) cells was used to analyze the data points. The two populations of RPE cells do not differ statistically (Mann Whitney t test, p>0.05). The two populations of LLC-PK1 cells differ statistically (Mann Whitney t test, p<0.0001, marked by ***).

