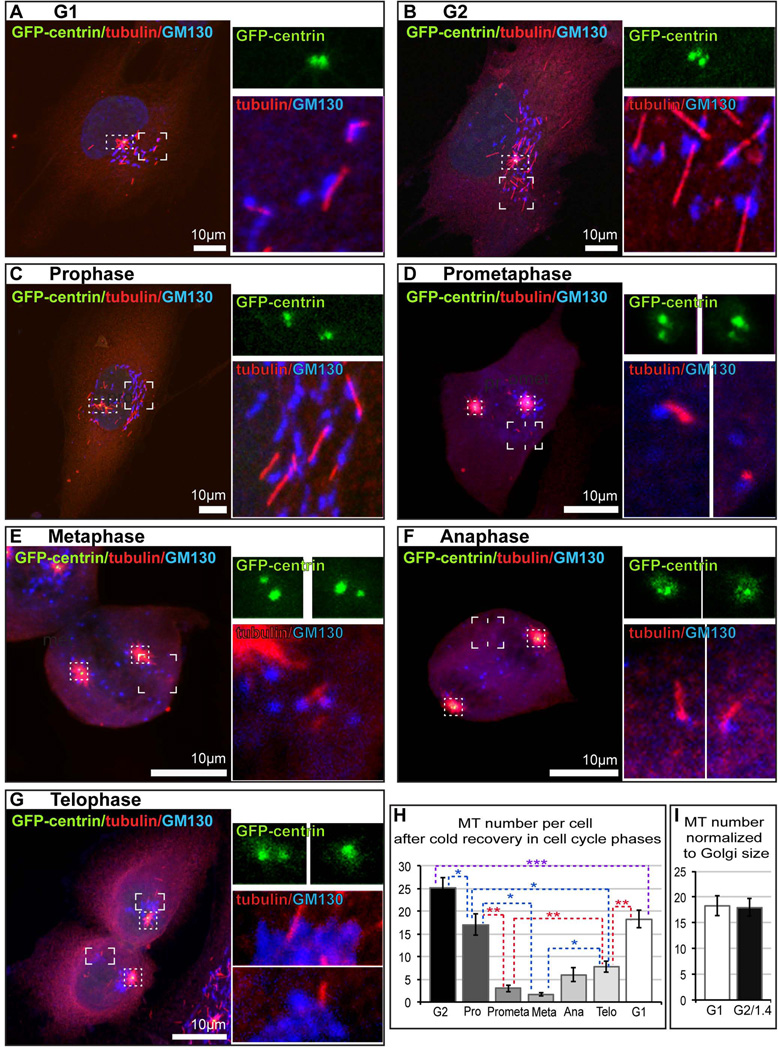
Figure 4. Ability of Golgi Membranes to Nucleate Microtubules is Regulated Throughout the Cell Cycle.
(A–G). Representative images of RPE1 cells at indicated cell cycle stages after short-term cold recovery. Confocal Z-stack maximal projections. For all stages, overview cell images (left panels) show maximal projections of the whole cells expressing GFP-centrin (green) immuno-stained for α-tubulin (red) and GM130 (blue, false color for far red). Scale bar, 10 µm. At the top right, insets visualize centrosomes (GFP-centrin channel enlarged form dotted boxes at the overview images). At the bottom right, insets visualize Golgi-associated MTs (GM130 and tubulin channels enlarged from cornered boxes at the overview images). Insets represent maximal projections of confocal planes only through the depicted structure. (H). Number of MTs associated with the Golgi per cell, based on data as in (A–G). (I). Number of MTs per cell in G1 compared to G2 corrected for the Golgi size difference.

