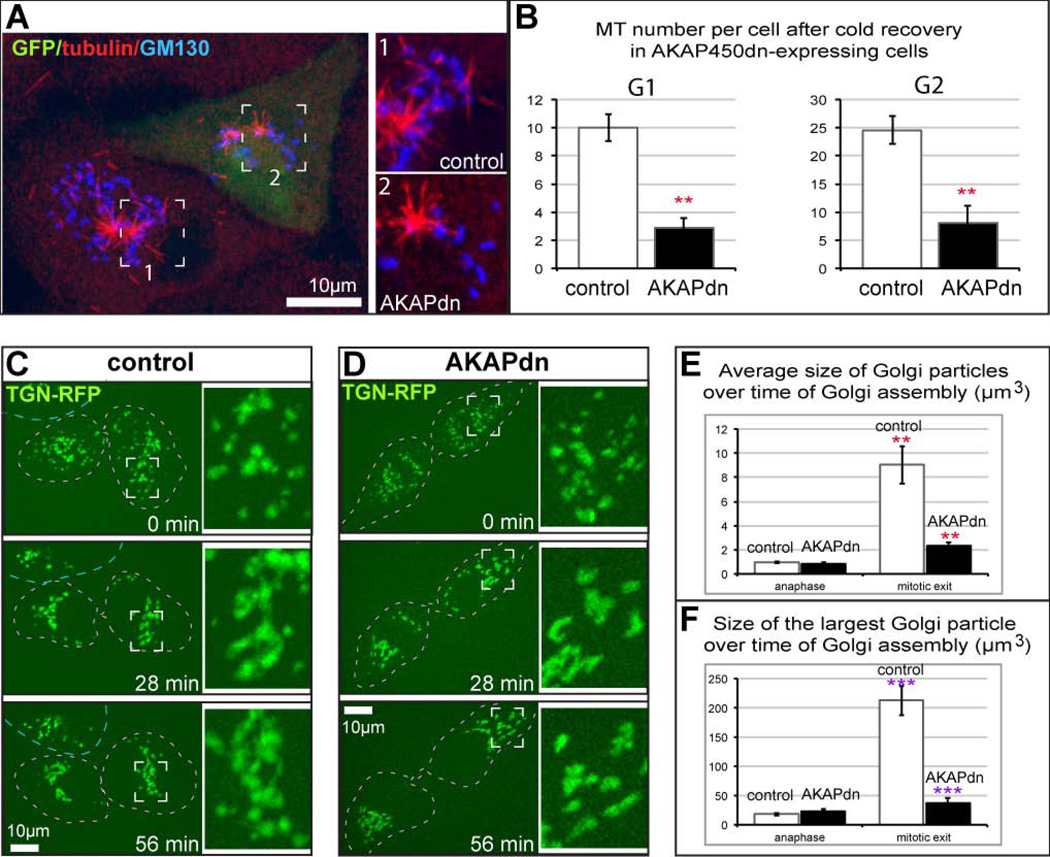
Figure 5. Golgi Reassembly during Mitotic Exit is attenuated in the absence of Golgi-derived MTs.
(A) Two G2 LLCPK cells after cold recovery (as in Figure 4) are shown. A non-transfected cell is on the left. Boxed region featuring MTs (red) at the Golgi (blue) in enlarged (inset 1). A cell expressing AKAPdn (marked by GFP, green) contains very few Golgi-associated MTs (right, inset 2). (B) Expression of AKAPdn significantly decreases Golgi-associated MT number in LLCPK in both G1 and G2. Student’s t test, p<0.01, marked by **. (C, D) Representative frames from time-lapse sequences dividing LLC-PK1 cells expressing RFP-TGN (false-colored green), visualized by spinning disk confocal microscopy. Maximal projection of confocal z stacks. Time, minutes. Scale bars, 10 µm. Boxed insets are enlarged on the left. (C) In control, Golgi mini-stacks are collected in a tight complex within 30 minutes. The average Golgi fragment volume increases from 1.3µm3 to 11.3µm3; the volume of the largest particle increases from 7.9µm3 to 77.1µm3. A representative example out of four movies. (D) A cell expressing AKAPdn (identified by GFP expression, not shown). Golgi stack clustering is incomplete after one hour of assembly. The average Golgi fragment volume increases from 1.1µm3 to 4.4µm3; the volume of the largest particle increases from 5.1µm3 to 39.6µm3. A representative example out of three movies. (E) Increase of the average volume of Golgi stacks in control and AKAP-dn-expression cells from anaphase to mitotic exit, based on LLCPK cells immunostained for GM130. N=5. Student’s t test, p<0.01, marked by **.(F) Increase of the largest Golgi stack (Golgi complex) in control and AKAP-dn-expression cells from anaphase to mitotic exit, based on LLCPK cells immunostained for GM130. N=5. Student’s t test, p<0.001, marked by ***.

