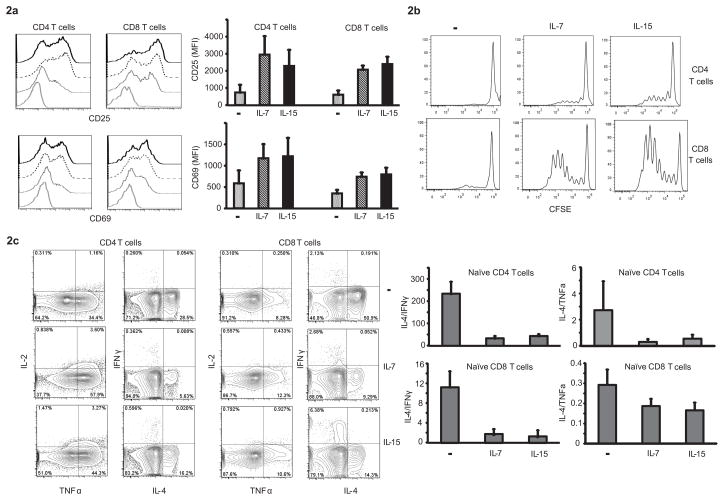
Figure 2. Functional consequences of cytokine priming.
(a) T cells conditioned with IL-7 or IL-15 were stimulated by crosslinking with anti-CD3/CD28 and assessed for activation markers CD25 and CD69 after 24 h. Representative histograms (left panel) are shown for negative FMO control (gray line), unconditioned (dotted line), IL-7 (dashed line) and IL-15 conditioned T cells (solid line). Results from three experiments are shown as mean ± SD (right panel). (b) T cells loaded with CFSE were conditioned with IL-7 or IL-15. After 24 h, cytokines were washed off and the cells transferred to anti-CD3/anti-CD28 coated plates. On day 7, cells were assessed for CFSE dilution in CD4 and CD8 subsets. Histograms representative of four independent experiments are shown. (c) FACS-sorted naïve T cells (CD27+CD45RA+) conditioned with cytokines for 24 h were washed, transferred to anti-CD3/anti-CD28-coated plates and cultured for 7d under non-polarizing conditions. On day 7, cells were restimulated with ionomycin/PMA, and the frequency of cytokine-producing cells in CD4 and CD8 subsets was assessed. Representative contour density plots (left panel) and ratios of IL-4/IFN-γ and IL-4/TNF-α cytokine producing cells (right panel) are shown as mean ± SD from three donors.

