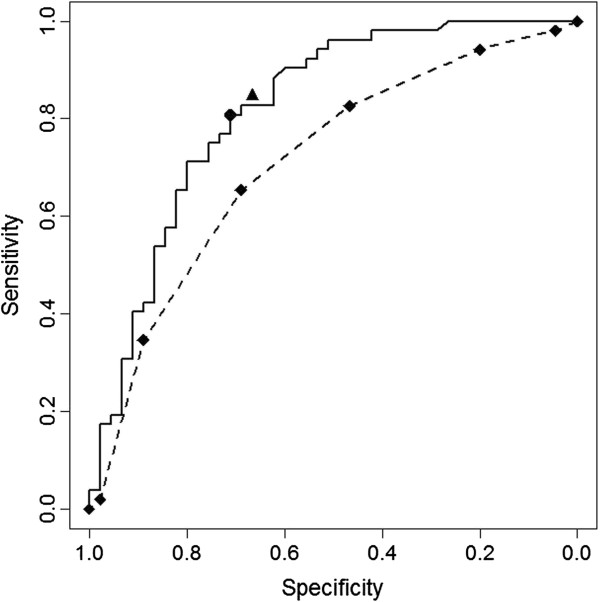
Figure 1.
Receiver-operating characteristic (ROC) curves for the logistic model with clinical and laboratory data (Logistic) and for the WHO criteria for probable dengue (WHO). Sensitivity and specificity at the best cut-off points for the models with clinical and laboratory data (●) and clinical data only (▲). ROC Curves (Area; 95% CI)_____ Logistic (0.82; 0.73–0.90); _ _ _ _ WHO (0.71; 0.61–0.81).

