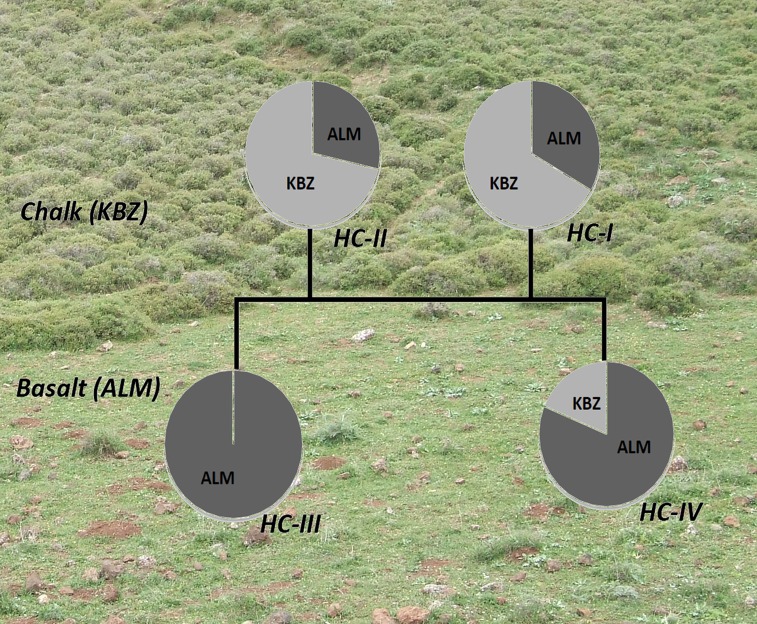
Fig. 2.
Picture of the site and pie graphs of the schematic phylogenetic relations of HC and their frequencies in basalt or chalk at the microsite. The background shows the sharp divergence of vegetation between chalk and basalt area. See Fig. 1 for geological map of the region and Fig. S1 for the schematic phylogenetic relations between HC. Please note that the pie graphs are not scaled to difference in the sample sizes.

