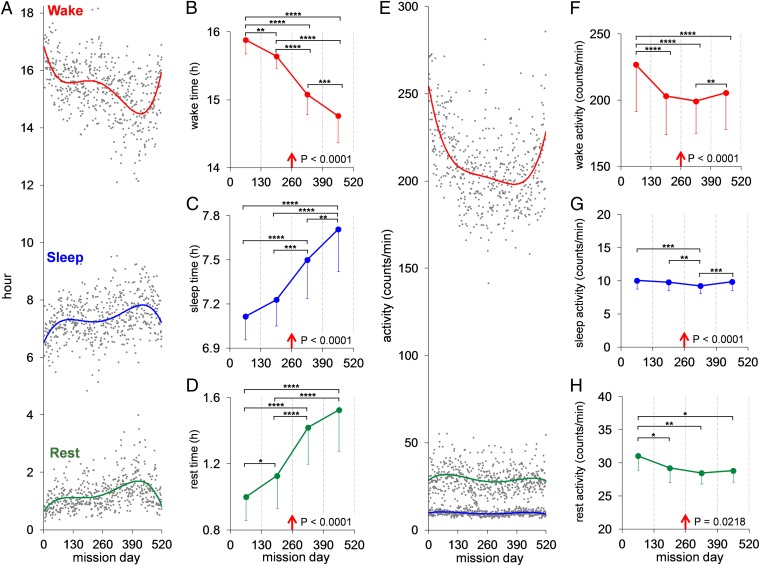
Fig. 1.
Activity profiles of crewmembers measured by continuously worn wrist actigraphs throughout the 520-d simulated mission. (A) The crew’s daily mean (gray points) time (hours) spent in active wakefulness (red trend line), sleeping (blue trend line), and resting (green trend line) across the mission (for information on statistical analyses, see SI Appendix, SI Text). (B–D) The crew’s mean (SE) time in each behavioral state for each consecutive 130-d MQ (red arrow shows simulated midmission landing on Mars). There was a systematic decrease across MQs in active wakefulness (B) and systematic increases in both sleep time (C) and waking rest time (D). F test P values for these effects are shown in each graph; post hoc tests between MQs: *P < 0.05, **P < 0.01, ***P < 0.001, ****P < 0.0001. (E) The crew’s daily mean (gray points) intensity of activity (counts per min) across the mission during active wakefulness (red trend line), sleep (blue trend line), and rest (green trend line). (F–H) The crew’s mean (SE) intensity of activity in each state by MQ. Activity levels declined in MQ 2 and much of MQ 4 relative to the first MQ, but rose in the final 20 d of the last MQ (F test P values are shown in F–H). The sharp increases in active wake time (A) and intensity (E) in the final 20 mission days, and the commensurate sharp decreases in sleep and rest times (A), were significantly different from mean values for these variables relative to two sequential 60-d periods immediately before the final 20 d of the mission (P < 0.002).

