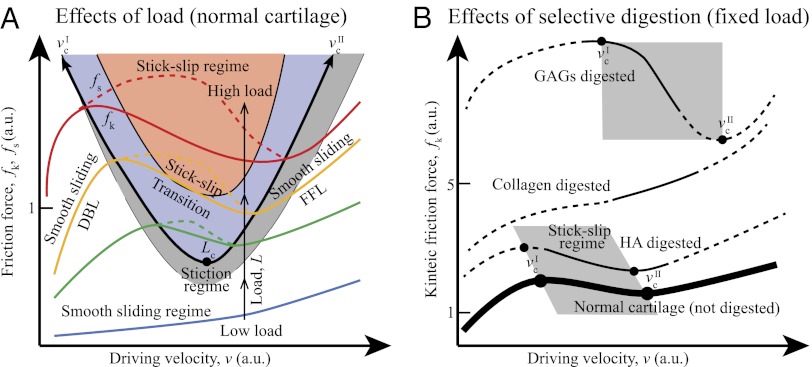
Fig. 6.
Generic friction maps of cartilage frictional behavior under mild sliding conditions. (A) Effect of load on friction map. Orange, purple, and gray shades indicate regular stick-slip, irregular stick-slip, and stiction regimes, respectively. (B) Effect of selective digestions. Dashed lines indicate the extrapolated trends expected from numerous experiments and theories (15). Closed circles indicate critical velocities when stick-slip appears ( ) and disappears (
 ). Gray shades indicate stick-slip regime windows.

