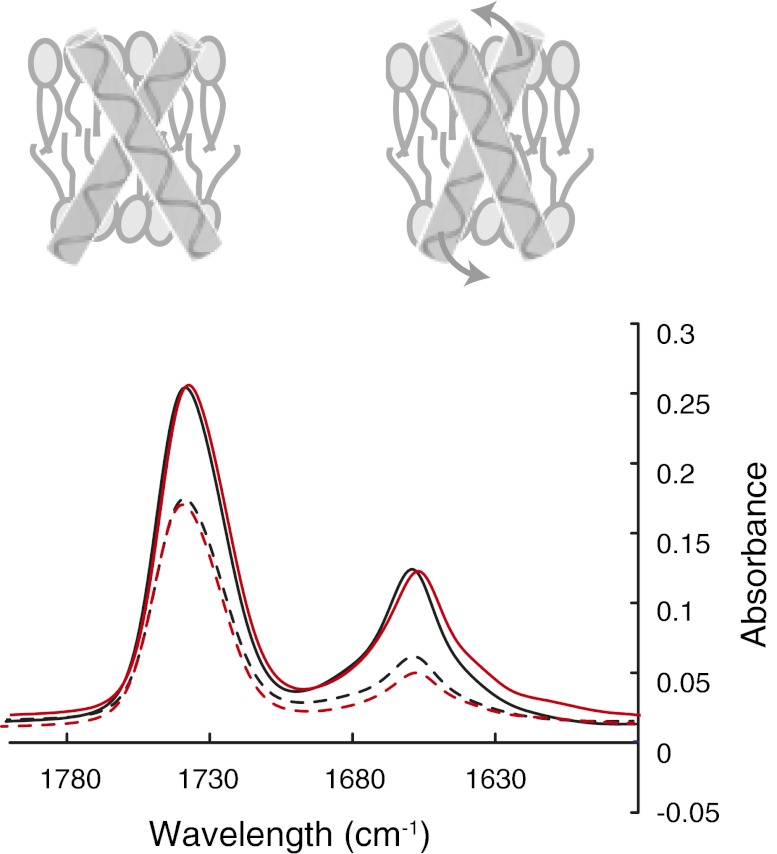
Fig. 6.
Polarized FTIR spectra of wild-type and W515K TpoR TM peptides. The wild-type (black) and W515K (red) TpoR spectra were obtained with light polarized parallel (solid line) or perpendicular (dashed line) to the membrane normal. The cartoon illustrates the proposed change in helix tilt angle upon W515K mutation. The IR band at 1,745 cm−1 corresponds to the lipid carbonyl vibration, whereas the band at ∼1,657 cm−1 corresponds to the protein amide I vibration. The dichroic ratios of the amide I band correspond to the average of three separate reconstitutions.

