Fig. 1.
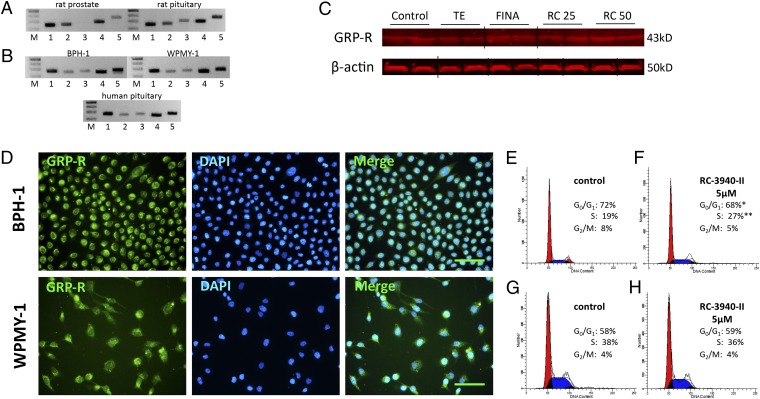
Expression of BN/GRP-type receptors and their ligands in rat prostate and human prostatic cell lines BPH-1 and WPMY-1. (A) Real-time RT-PCR analysis of (1) bombesin-type receptors neuromedin-B receptor (NMB-R), (2) gastrin-releasing peptide receptor (GRP-R), (3) bombesin-like receptor 3 (BRS-3), and ligands (4) NMB and (5) GRP in rat prostates. Rat pituitary was used as positive control. DNA molecular weight marker is shown in lane M. (B) Real-time RT-PCR analysis of bombesin-type receptors (1) NMB-R, (2) GRP-R, (3) BRS-3, (4) NMB, and (5) GRP in BPH-1 human prostate epithelial cells derived from a BPH patient and WPMY-1 normal human prostate stromal cells. Human pituitary was used as positive control. (C) Western blot analysis of GRP-R in rat prostates. Representative blots of three independent experiments are presented and include β-actin as an internal standard; corresponding signal intensity values are shown in Fig. S1. Grouping of representative bands for each experimental group was performed digitally. DNA molecular weight marker is shown in lane M. FINA, finasteride (0.07 mg/kg); RC 25, RC-3940-II (25 µg/d); RC 50, RC-3940-II (50 µg/d). (D) Presence of GRP receptor (green) in BPH-1 and WPMY-1 cells. (Scale bar, 50 µm.) (E–H) Cell cycle distribution analysis of BPH-1 cells (E and F) and WPMY-1 cells (G and H) by flow cytometry. (F) In BPH-1 cells exposed to 5 µM RC-3940-II, a significant increase in the number of cells blocked in S phase (27%), whereas the number of cells with G0/G1 DNA content decreased (68%), compared with E (control). The histograms represent three independent experiments. *P < 0.05; **P < 0.05.

