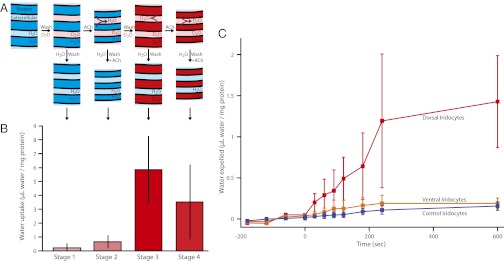
Fig. 3.

Iridocytes exchange water with their external environment commensurate with change in iridescence. (A) Diagram of the iridocyte platelet swelling and shrinkage by fluxes of water, as revealed by the first experiment. The samples begin in a relaxed state (hydrated with unlabeled seawater). Immersion of the sample in seawater spiked with isotopically labeled water allows diffusion of D2O into the interplatelet space (stage 1). Stimulation by ACh drives expulsion of the previously loaded unlabeled water, collapsing the platelets (stage 2). After washing away the ACh, the platelets relax back to a hydrated state, swelling by uptake of the isotope enriched seawater from the cell’s exterior (stage 3). Finally, a second stimulation with ACh expels some of the labeled water from the platelets (stage 4). Finally, all samples are washed in isotope-free seawater. (B) Data showing the amount of water taken up at each stage of the experiment calculated from the enrichment in deuterium signal and normalized to the protein content of each sample, as described in Materials and Methods (n = 4). Error bars show one SD. (C) Data showing water released from the cells after stimulation by ACh at t = 0. Tissues were first equilibrated in D2O-enriched water and then stimulated with ACh; the increase in D2O in the surrounding seawater was measured. The red line represents dorsal samples, the orange line represents ventral samples, and the blue line represents control (no ACh) samples. The deuterium signal was normalized to protein content and used to calculate the total movement of water; error bars represent SD.
