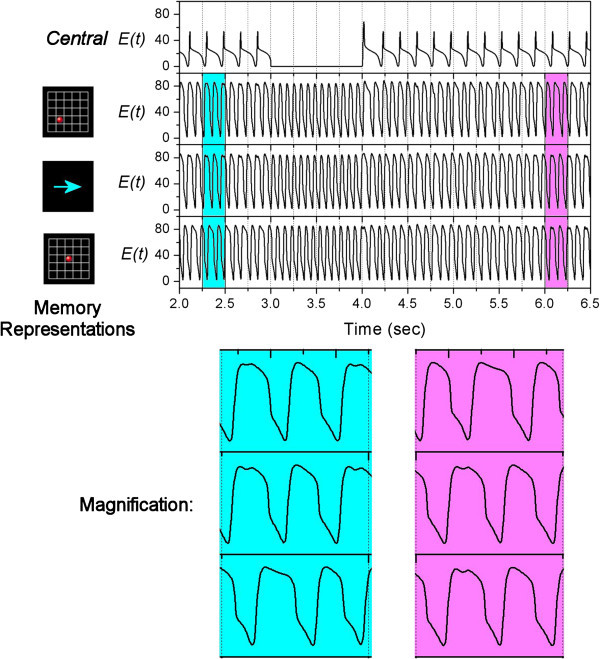
Figure 7.

Error correction. The main figure shows the activity rates of the Central Unit (top panel) and 3 Memory Units respectively. The Memory Units represent different visual objects which are shown on the left side. The blue and pink portions of the main figure are magnified and shown at the bottom.
