
Figure 1.
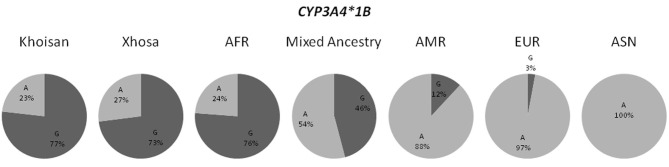
Distribution of the CYP3A4*1B allele frequencies in all three South African populations and the four populations present in the 1000 Genomes Browser. (AFR, African; AMR, American Admixed; ASN, East Asian; EUR, European).
Official websites use .gov
A
.gov website belongs to an official
government organization in the United States.
Secure .gov websites use HTTPS
A lock (
) or https:// means you've safely
connected to the .gov website. Share sensitive
information only on official, secure websites.
Distribution of the CYP3A4*1B allele frequencies in all three South African populations and the four populations present in the 1000 Genomes Browser. (AFR, African; AMR, American Admixed; ASN, East Asian; EUR, European).