Figure 3.
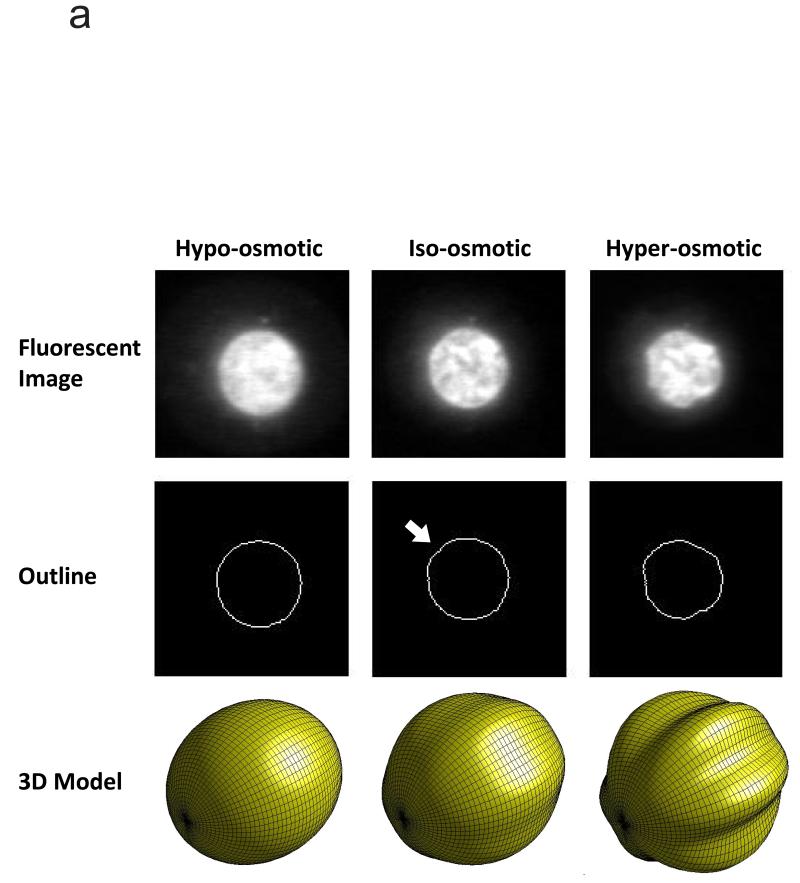
Changes in the nuclear morphology of chondrocytes with osmotic stress. (a) The middle column depicts the iso-osmotic or equilibrium condition (380 mOsm). The osmotic pressurization of the nucleus is barely sufficient to induce mild buckling of the nuclear lamina, as evidenced by the mild undulation in the outline of the nucleus (white arrow). The image in the bottom row of the middle column shows a 3D view of a mildly postbuckled spheroid. The left column depicts the hypo-osmotic condition (180 mOsm). The undulation has disappeared, and the outline of the nucleus is now smooth. The right column depicts the hyperosmotic condition (580 mOsm). Now there are pronounced undulations along the entire circumference of the nuclear outline. The image in the bottom row of this column shows a 3D view of a spheroidal geometry with pronounced longitudinal buckling. These reconstructions are hypothesized to be representative of the nuclear outlines depicted in the middle row. Adapted from Reference 135 with permission. (b) Hyperosmotic challenge on live bovine chondrocytes transfected with H2B-GFP. Chondrocytes were cultured in monolayer initially in an iso-osmotic environment (300 mOsm kg−1) and subjected to hyperosmotic challenge (700 mOsm kg−1) for 15 min, and then brought back to 300 mOsm kg−1 for an additional 15 min while being imaged by time-lapse confocal microscopy. The top row shows an average intensity projection in the xy plane. The middle row shows an average intensity projection in the xz plane. The bottom row shows the middle section of the chondrocyte nuclei. Images were thresholded using the iterative self-organizing data algorithm (134; J. Irianto, R.P. Martins & D.A. Lee, unpublished data). Abbreviations: GFP, green fluorescent protein; mOsm, milliosmole.

