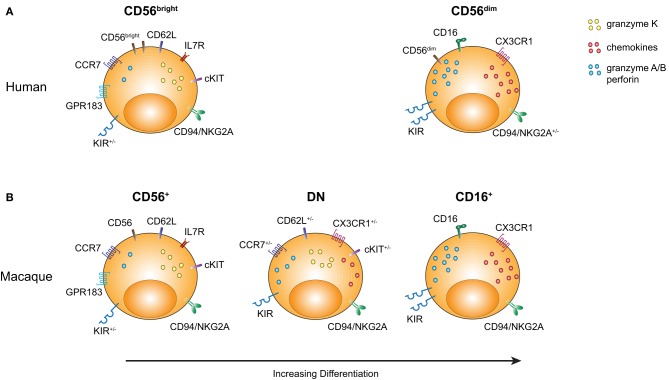
Figure 2.
Comparison of rmNK and hNK cell subpopulations. Markers characterizing the distinct NK cell subpopulations are illustrated with an emphasis on molecules either indicating a more primitive stage of hematopoietic differentiation or an effector cell profile. (A) Human CD56bright and CD56dim NK cells are shown. (B) Rhesus CD56+, DN, and CD16+ NK cell subsets are shown.

