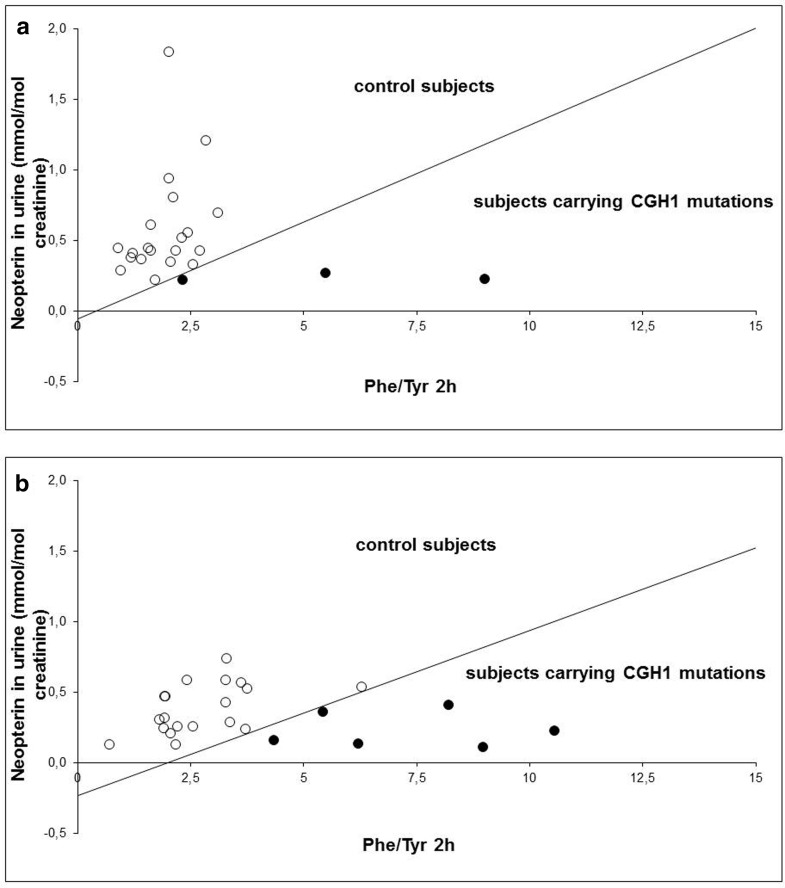
Fig. 2.
Scatter plot of Phe/Tyr at second hour and neopterin values. The white dots represent controls (39) and the black dots patients (9) included in the ROC analysis. The curve divides the space into two areas, namely the area of control subjects above the curve and the area of subjects carrying GCH1 mutations below the curve. Each patient can be represented as a point in this space according to their values of neopterin and Phe/Tyr ratio 2 h after Phe loading: if the point lies in the area below the curve, the patient has a high probability of carrying a GCH1 mutations, whereas if they lie in the area above the curve, the patient has a high probability of not carrying a GCH1 mutation. Decision rule can be expressed by the following analytical expressions. The test is positive if “-27.47 - 464.38 * [neopterin] + 63.93 * Phe/Tyr2h > 0” for subjects younger than 15 years (a) and “-106.91 - 456.85 * [neopterin] + 53.48 * Phe/Tyr2h > 0” for subjects older than 15 years (b), where [neopterin] is the concentration of neopterin in urine (expressed in mmol/mol creatinine) and Phe/Tyr2h is the ratio between Phe and Tyr concentrations in dried blood spot (each expressed in μmol/l of blood) 2 h after Phe loading

