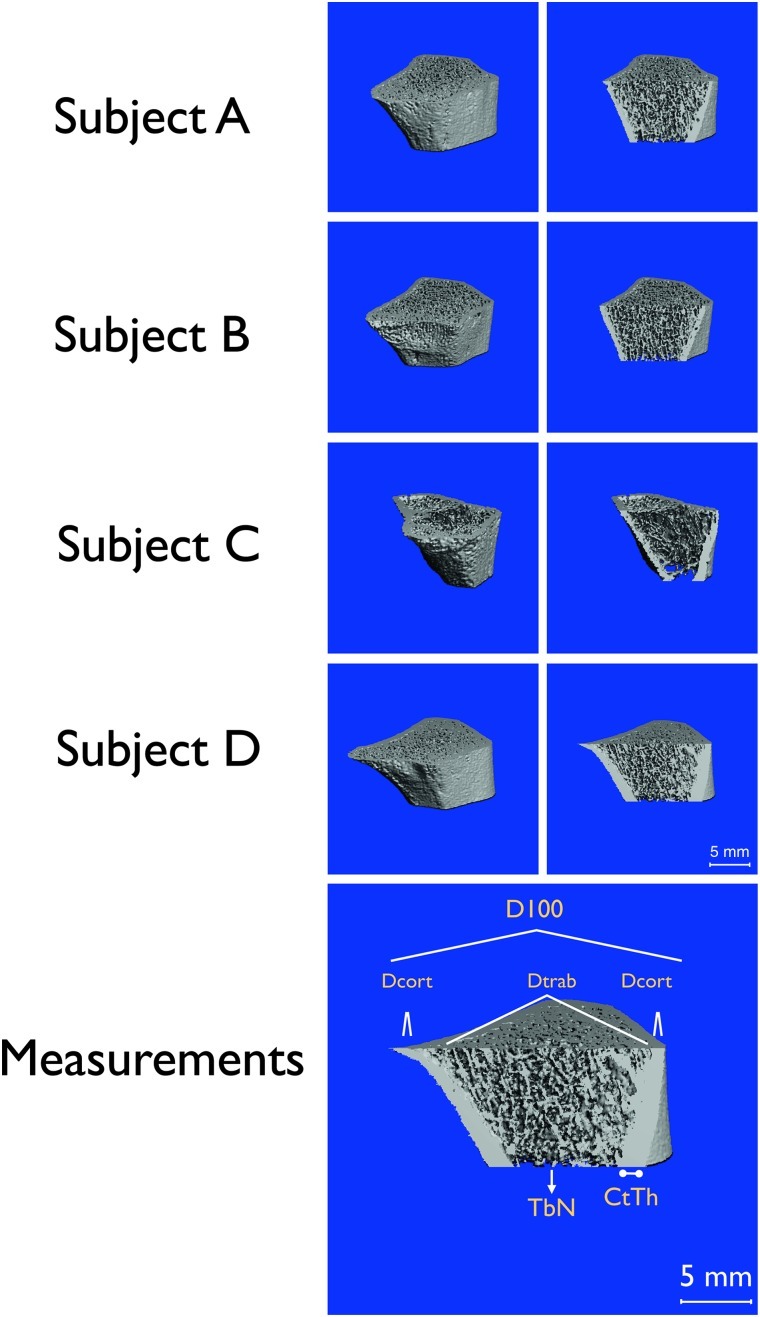
Fig. 2.
Top. Three-dimensional HR-pQCT imaging of left radius representing a 9.02 mm axial region located 9.5 mm from the distal end of the radius. Left column shows the entire scan and the right column shows the interior microarchitecture from the same scan data. Bottom. Measurements. Graphical representation of average density at the radius (D100), density of compact bone (DComp) and trabecular bone (Dtrab), and bone architecture represented by cortical thickness (CtTh) and trabecular number (TbN)

