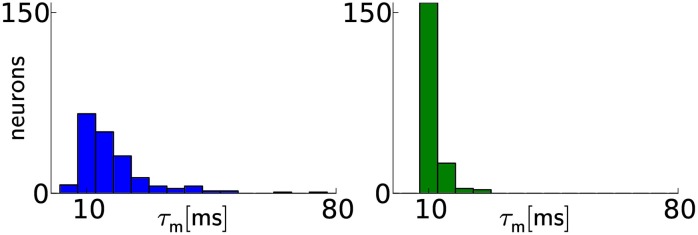
Figure 3.

Calibration results for membrane time constants. Before calibration (left), the distribution of values has a median of ms with 20th and 80th percentiles of ms and ms, respectively. After calibration (right), the distribution median lies closer to the target value and narrows significantly: with and Two neurons were discarded, because the automated calibration algorithm did not converge.
