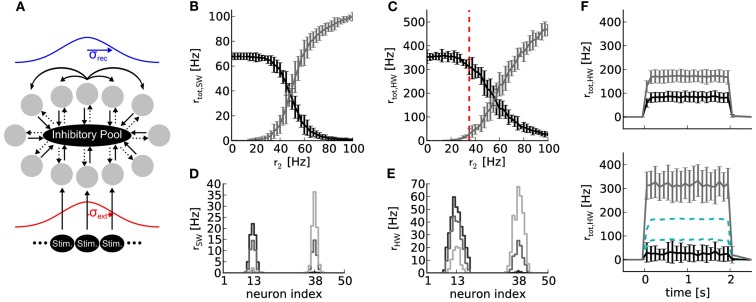
Figure 6.
(A) Topology of a soft winner-take-all network with 50 excitatory (gray circles) and 16 inhibitory neurons. Solid and dotted arrows denote excitatory and inhibitory connections, respectively. The strength profile of recurrent connections between excitatory neurons and external stimulations is schematized in blue and red, respectively (for details, see text). All projections between neuron populations have a connection probabilities of p = 1, except the projection between the excitatory and inhibitory neuron population (p = 0.6). (B) Results of software simulation (SW). Black curve: total firing rate of the reference half where constant external stimulation is received (r1 = 50 Hz at μext = neuron index 13). Gray curve: total firing rate of the neurons in the half of the ring where varying external stimulation with rate r2 between zero and 100 Hz is received (at μext = neuron index 38). Firing rates rtot of all neurons in each half of the ring were averaged over 10 runs with 2 s duration and different random number seeds for drawing the stimulus spike trains. (C) Same network topology and stimulus as (B), but emulated on Spikey (HW). (D) Firing rate distribution over neuron indices for r2 = 25 Hz (black), 50 Hz (dark gray), and 75 Hz (light gray). (E) Same as (D), but emulated on Spikey. (F) Top panel: time course of firing rates for stimulus indicated in (C) with red dashed line, but without recurrent connections. All excitatory neurons are solely driven by an external stimulus of r1 = 50 and r2 = 35 Hz, respectively. Firing rates were averaged over 100 runs. Bottom panel: same as top panel, but with recurrent connections. For better comparison, data of the top panel is drawn in cyan dashed lines.

