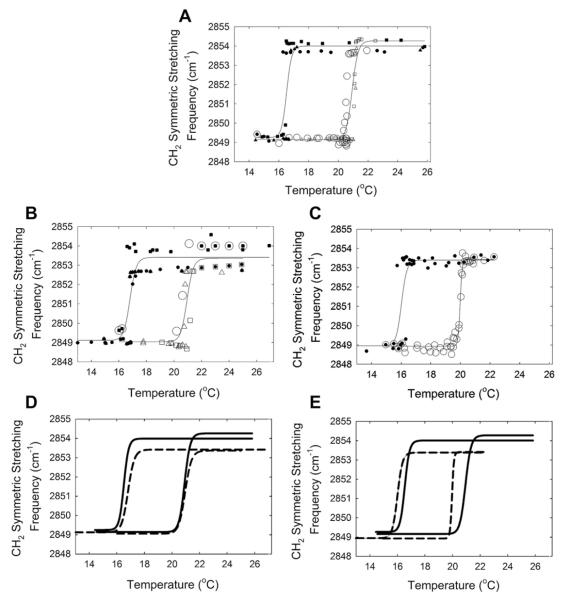
Fig. 1.
Lipid phase transitions measured using infrared spectroscopy. Open symbols are heating curves, filled symbols are cooling curves. Symbol types represent separate experiments. Lines are curve fit of a 4-parameter sigmoidal equation to the data. A) palmityloleate. B) palmityloleate and Keratin 1:1, wt:wt. C) palmityloleate and β-carotene 1:1, wt:wt D) (—) fit of palmityloleate curves from A (–) fit of palmityloleate and Keratin curves from B. E) (—) fit of palmityloleate curves from A (–) fit of palmityloleate and β-carotene curves from C.

