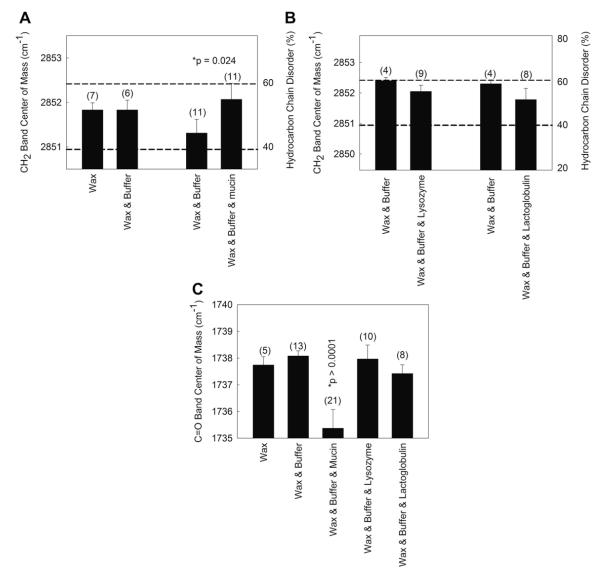
Fig. 3.
Band center of mass was calculated from the infrared spectra of a thin film of the wax mixture oleyloleate and stearylpalmitate (4:1, wt:wt) exposed to a buffer containing various proteins found in human tears. A and B) The infrared CH2 symmetric stretching frequency (left y axis) is used to calculate the hydrocarbon order (right y axis) of the wax mixture. C) The wax carbonyl band center of mass can be used to ‘sense’ the environment around the ester bond. A higher carbonyl band center of mass indicates a more hydrophilic environment or hydrogen bonding.

