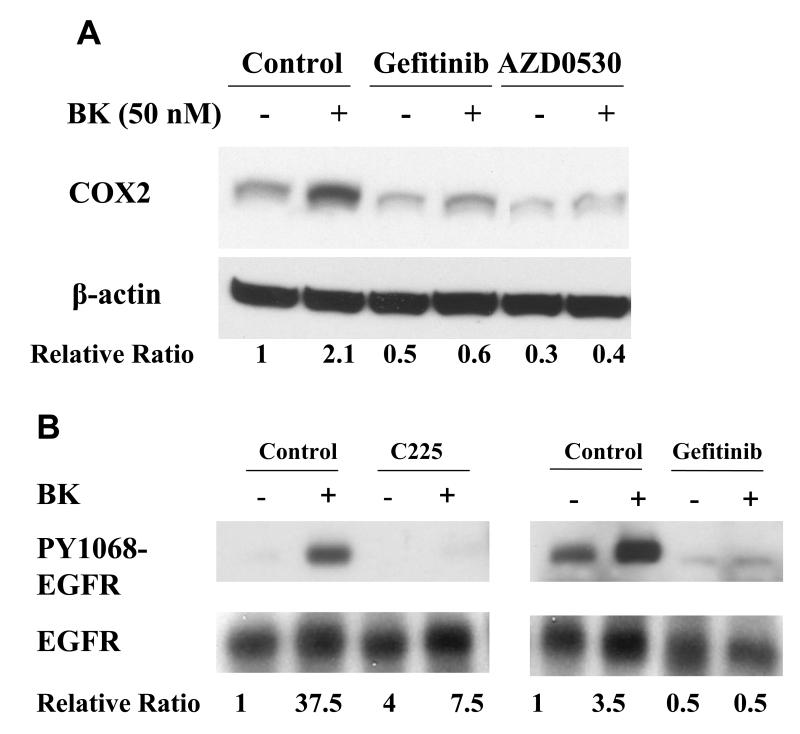
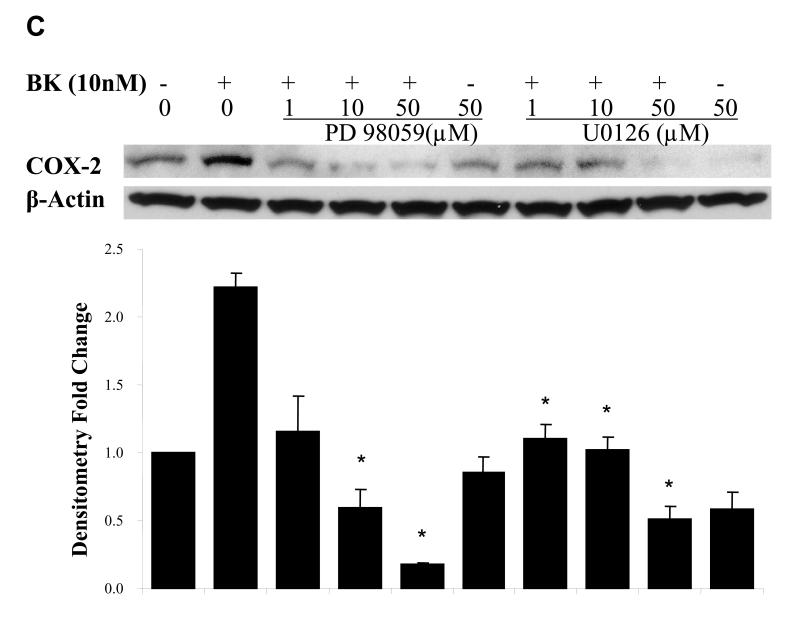
Figure. 5. EGFR and MAPK are required for COX-2 induction by BK.
PCI-37A cells were serum-deprived for 3 days followed by subsequent treatments. (A) BK-induced COX-2 expression in presence of an EGFR or a src inhibitor. Cells were pretreated for 60 min with vehicle, the src inhibitor AZD0530 (1 μM) or the EGFR TKI gefitinib (1 μM) followed by treatment with BK (50 nM) for 2 h, and COX-2 protein levels were analyzed by immunoblotting. Relative ratios of COX-2 expression versus β-Actin expression were calculated from two independent experiments. (B) Effect of EGFR inhibition on phosphorylation of EGFR in response to BK. Cells were pre-incubated with vehicle, the EGFR antibody C225 (100nM) or the EGFR TKI gefitinib (1 μM) for 5 min and then treated with BK (50 nM) for 10 min. EGFR phosphorylation at a representative autophosphorylation site Y1068 and total EGFR were analyzed by immunoblotting. Relative ratios of p-EGFR (PY1068) phosphorylation versus total- EGFR were calculated. This is a representative experiment that was repeated two additional times with similar results. (C) BK-induced COX-2 expression in presence of MEK inhibitors. Cells were pretreated with vehicle or MEK inhibitors PD 098059 (1 - 50 μM) or U0126 (1 - 50 μM) for 1 h before treatment with 10 nM BK for another 2 h, and COX-2 expression was determined by immunoblotting with COX-2 antibody. Representative immunoblots are shown. The graph presents the fold-change in protein level compared to control as determined by densitometry (cumulative results from three independent experiments) and correlates to the lane shown directly above each bar. Data shown are the means ± SE. Symbol * indicated P < 0.05 as compared with the BK treatment.


