Figure 1. .
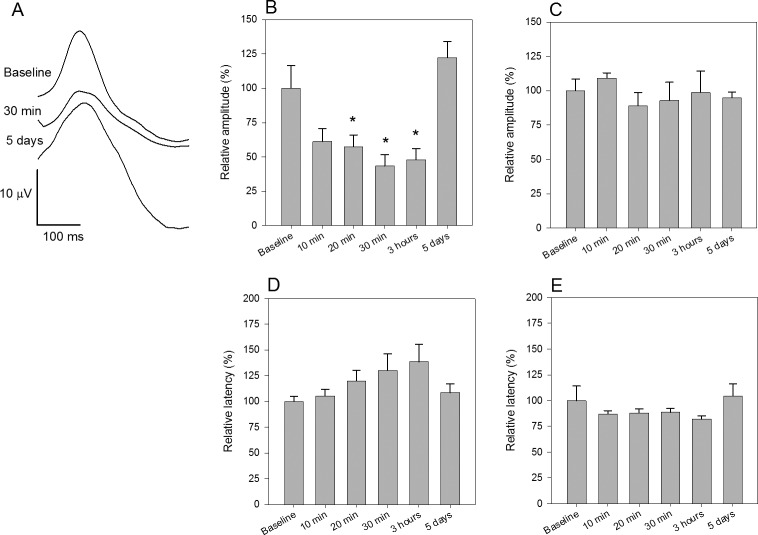
Effect of retrobulbar lidocaine injection on PERG. (A) Representative examples of PERG waveforms recorded before, and 30 minutes and 5 days after injection. (B) Mean PERG amplitude (B) and latency (D) before and at different times after injection. (C, E) Mean PERG amplitude (C) and latency (E) before and after retrobulbar saline injection. All data were normalized to mean baseline values ([B] 28.4 μV, SEM 2.7; [D] 94.0 ms, SEM 4.6, n = 9; [C] 26.3 μV, SEM 2.1; [E] 92.5 ms, SEM 10.5, n = 5). Errors bars represent the SEM. Significance (P < 0.05) of the effect compared to baseline is represented by asterisks above bars.

