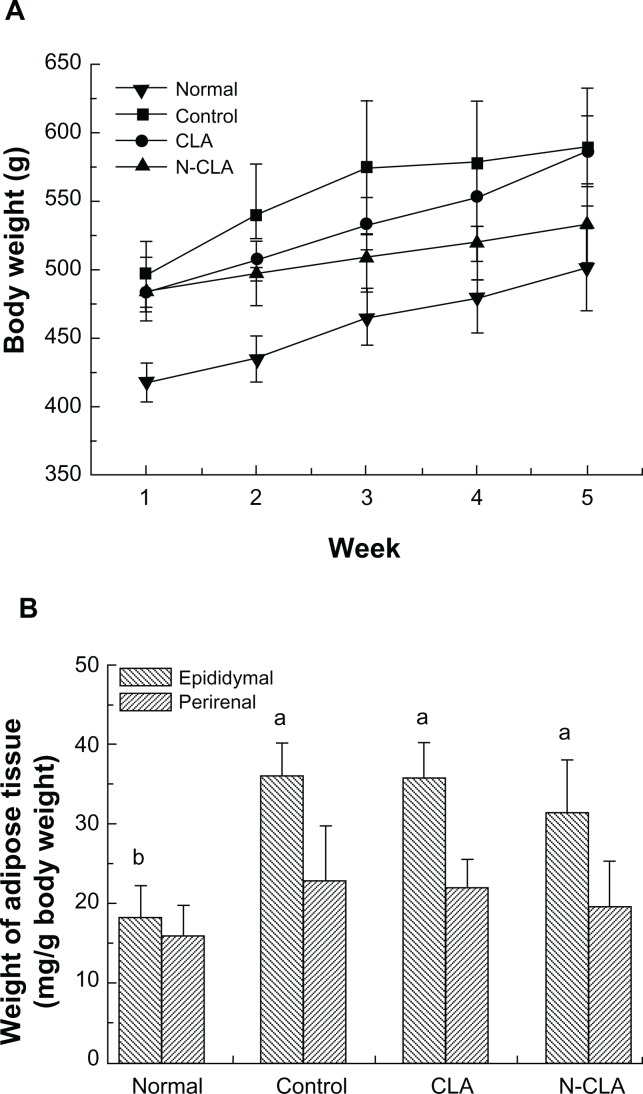
Figure 2.
Changes in body weight (A) and adipose tissue weight (B) in rats fed an experimental diet for 5 weeks.
Notes: Data are presented as the mean ± standard deviation. a,bNot sharing a same letter indicates a significant difference between groups at P < 0.05. Normal, rats fed a normal diet; control, rats fed a high-fat diet; CLA rats fed on a high-fat diet and 2% CLA, (0.6% CLA content); N-CLA, rats fed a high-fat diet + 2% N-CLA (0.6% CLA content).
Abbreviations: CLA, conjugated linoleic acid; N-CLA, nanoemulsified water-soluble conjugated linoleic acid.

