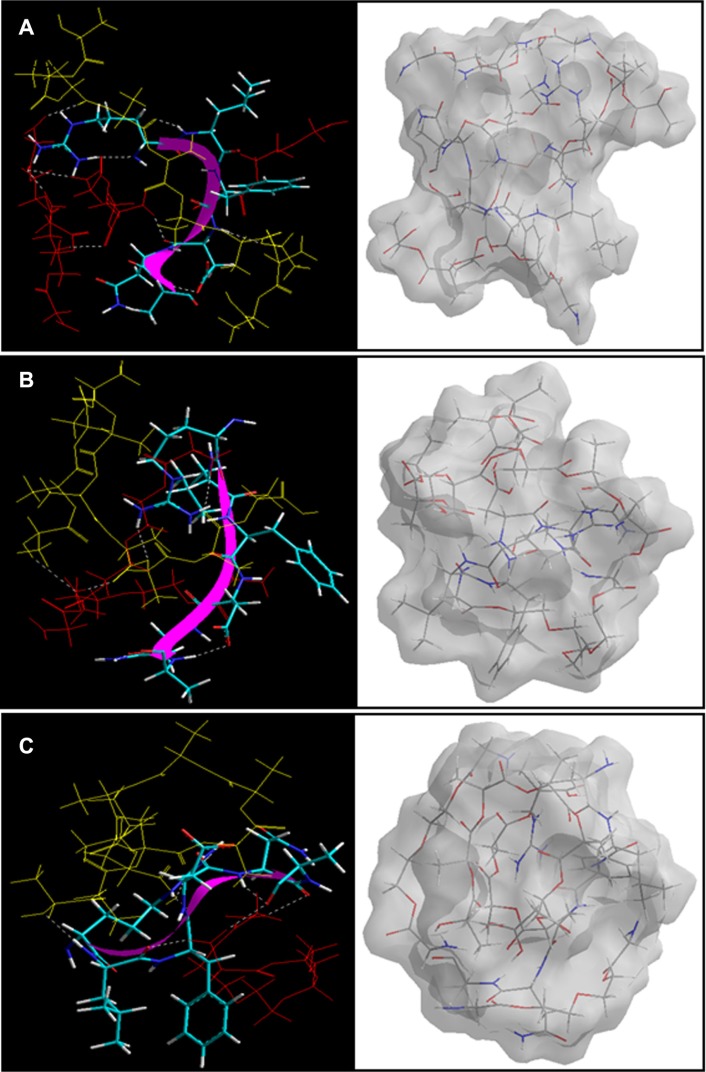
Figure 11.
Visualization of geometrical preferences of the insulin molecule in complexation with (A) PLA-PEG14, (B) PLA-PEG22, and (C) PLA-PEG41 after molecular simulations in vacuum.
Notes: The peptide molecules are rendered in tube (elements color coded) and thin-ribbon secondary structures (violet). Color codes for insulin tube rendering: C (cyan), O (red), H (white), and P (yellow). The respective Connolly molecular electrostatic potential surfaces for the nanoparticulate matrix in transparent display mode are also shown.

