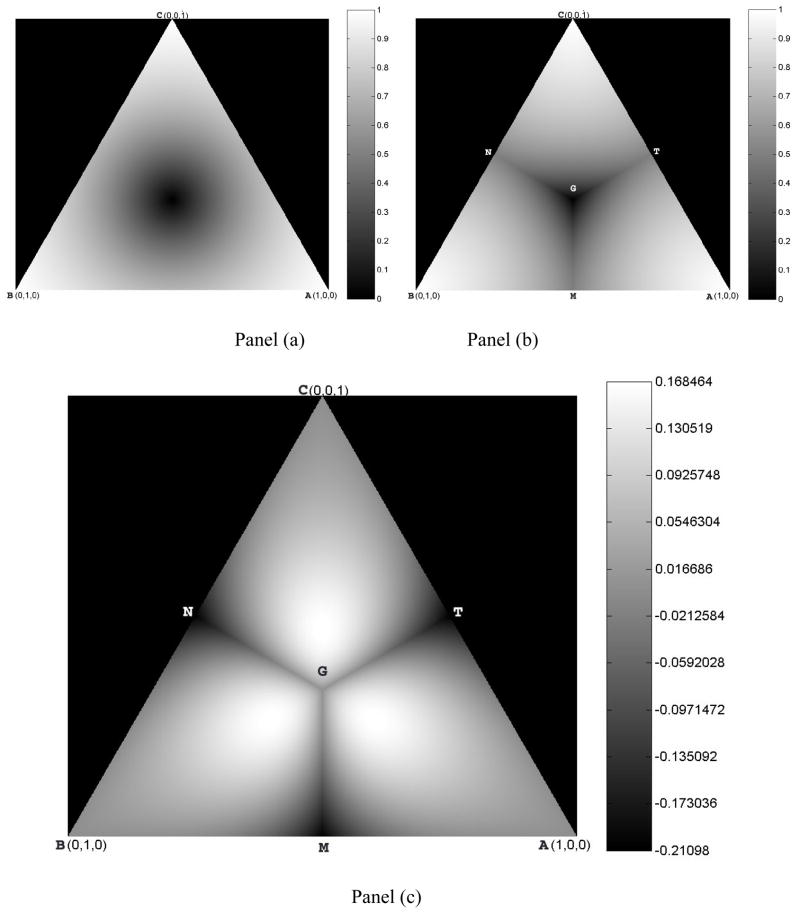
Figure 4. Comparison of EAR and FA Values on the Section Plane ABC in Fig. 1.
Panel (a) show a map of FA values on plane ABC; FA values form concentric circles along the center of the equilateral triangle. Panel (b) shows a map of EAR values on plane ABC; each of the 3 naturally divided regions (i.e., AMGT, BMGN, CNGT) corresponds to the situation in which one of the three eigenvalues is more prominent than the other two. Triangle AGM corresponds to the one-sixth portion of the cube in which λ1 ≥λ2 ≥λ3. Panel (c) shows a map of the differences obtained when subtracting FA from EAR. The Line segment AGN corresponds to the cylindrical symmetry index A (Fig. 2), on which line segment AG corresponds to the case in which λ1 >λ2 =λ3 and line segment GN to λ1 <λ2 =λ3. The values for EAR are higher than those for FA, particularly in regions along the line segment AG. To the right of each image is a color bar that shows the numerical value corresponding to each gray-scale intensity within the image.

